

Image Source: Pixabay
Brad DeLong directed me to a tweet that contained this intriguing graph:
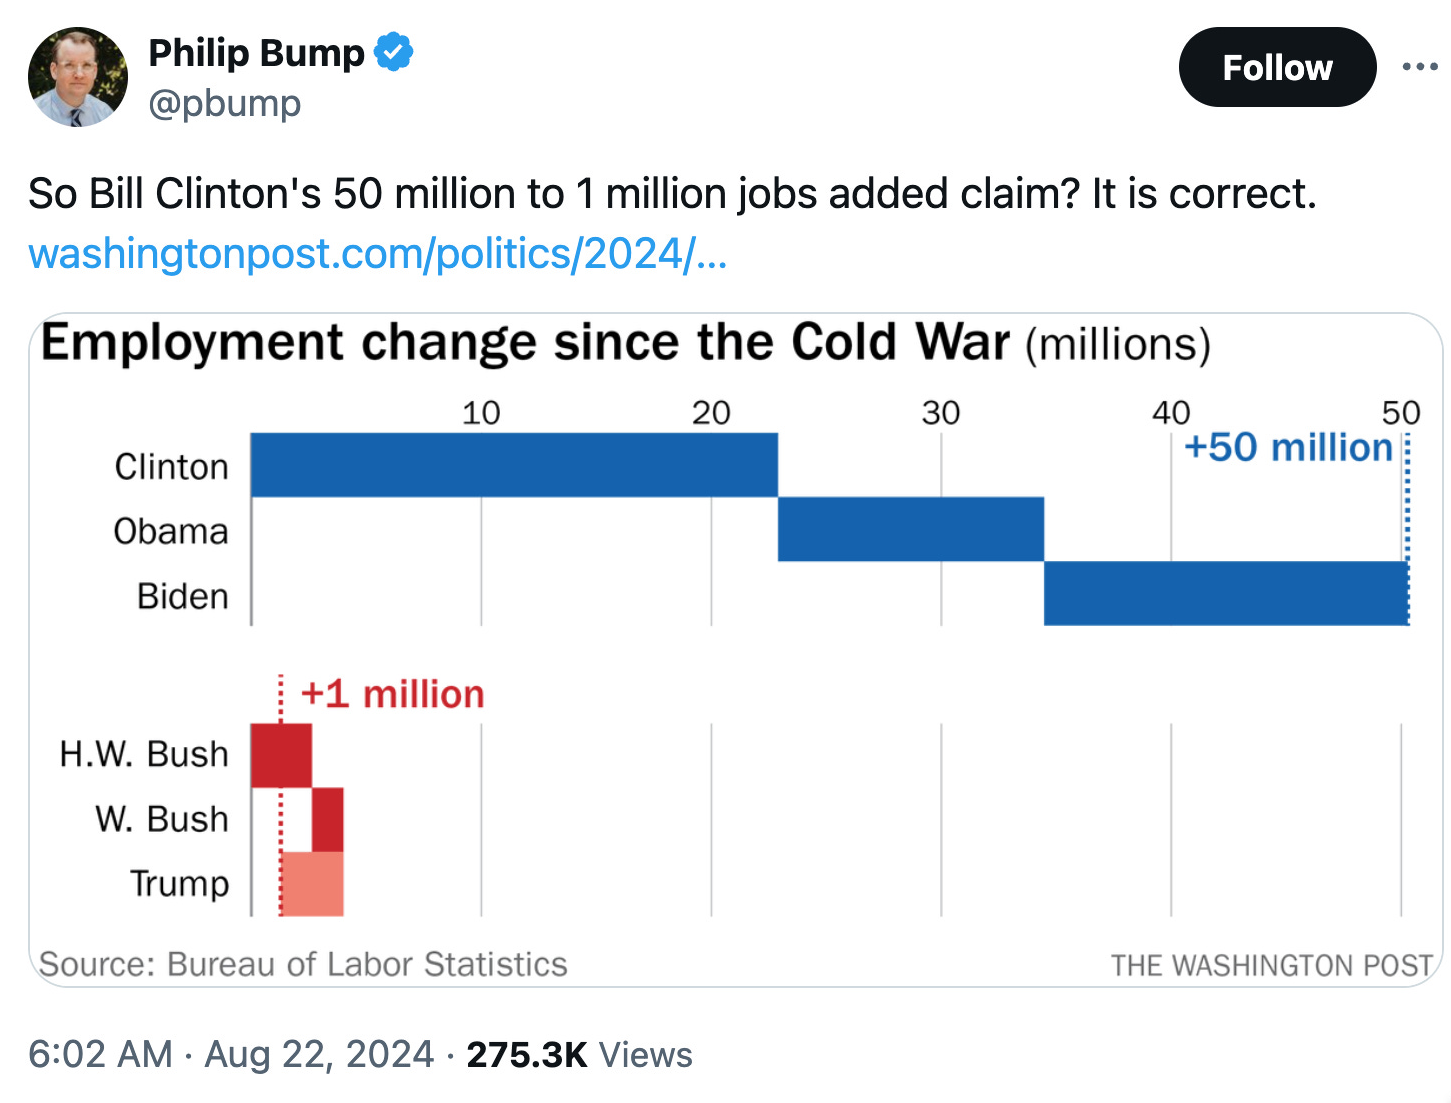
If you polled 51 million Americans and found that 50 million supported X, whereas 1 million opposed X, that would be a highly significant survey. So what should we make of the fact that over the past 35 years, Democratic presidents have “created” (been associated with) 50 million net new jobs and GOP presidents have been associated with 1 million net new jobs? Isn’t 51 million a statistically significant sample size?
Of course what’s really going on here is that we have only 6 observations, six administrations. Is it unusual that the three Democratic administrations were associated with fast job growth, or just luck? That’s actually not an easy question to answer. It’s at least partly luck, as no one seriously believes that the poor Trump performance is due to anything other than being in office when Covid hit. (Trump did mishandle Covid in some respects, but that wasn’t the deciding factor. Even though I’m a Trump hater, I don’t blame him for the poor jobs numbers or the poor crime statistics when he was in office)
If I were a Democratic partisan, I’d make a different argument. Ten of the past eleven recessions (since 1952) have occurred under GOP presidents. I mention this because the graph above is largely explained by the fact that each GOP president happened to finish his term in office during a recession or the early stages of recovery. It’s a business cycle issue. Republicans have been either very unlucky, or have been less adept at macroeconomic stabilization policy than Democrats.
So is this 10-1 ratio statistically significant? That’s not really the right way to think about these things. We wouldn’t be discussing the issue at all unless the ratio looked odd. We select usual patterns when deciding what to write blog posts on. A better approach would be to ask if there are policy differences between the GOP and the Democrats that can explain this pattern.
I imagine no one will like this answer, but I suspect that the 10-1 ratio is largely but not totally random. During much of this period, the GOP had more of an anti-inflation bias, whereas the Dems had more of a pro-jobs bias. As a result, some of the GOP recessions were plausibly caused by earlier Democratic over-stimulus. But not all. I’d say 1970 and 1981 are the two clearest cases of recessions that occurred under GOP presidents that were caused by previous Democratic over-stimulus. Maybe 1953, but that was probably more of a post-Korea War thing.
So the GOP is probably not as bad as the 10-1 ratio would suggest. Even so, there are some other data points that are hard to explain away. Why did Eisenhower have 3 recessions? Again, all of the Democratic presidents since 1952 have only generated one recession (in 1980.) And that was the mildest of the 11 recessions.
To summarize, the 50 million to 1 million ratio is a great talking point for Dems, but largely coincidence. On the other hand, a careful look at the factors causing recessions suggests that the Dems might really have been somewhat better on the jobs front.
Of course today’s GOP is nothing like the Eisenhower GOP. In addition, the Fed has gotten gradually better in lengthening the business cycle. I strongly doubt that we will see 3 recessions in the next 8 years, regardless of which party is in power.
PS. Don’t take this post as me dumping on Eisenhower, who was vastly better than recent GOP presidents.

More By This Author:
Do Tariffs Raise Prices?Goods, Services And Tariffs
Heterodox Views On Monetary Policy


Comments
Log in or sign up to join the conversation.