
BEA Reports That 2nd Quarter 2019 GDP Growth Grew At 2.05%
In their first (preliminary) estimate of the US GDP for the second quarter of 2019, the Bureau of Economic Analysis (BEA) reported that the US economy was growing at a +2.05% annual rate, down -1.04 percentage points (pp) from the downward revised prior quarter.
In this report the BEA also revised all of the numbers for 22 quarters dating back through 2014. Although each of the prior 4 quarters was revised downward (including a material -1.07pp downward revision to the 4th quarter of 2018), the average quarterly revision was a modest +0.02pp upward.
The line item numbers in this report also reversed a number of trends observed in prior quarters. Consumer spending came roaring back, contributing an aggregate 2.84pp to the headline number, the most since the 4th quarter of 2017. Meanwhile, fixed commercial investments and inventories reversed course, subtracting -1.00pp from the headline. The growth in government spending more than doubled to +0.85%, while foreign trade (both exports and imports) weakened substantially, lowering the headline number by -0.64pp.
Household disposable income was reported to be $213 higher than in the upwardly revised prior quarter, and the household savings rate was reported to have dropped -0.4pp to 8.1% from an upwardly revised prior quarter.
For this estimate the BEA assumed an effective annualized deflator of 2.51%. During the same quarter (April 2019 through June 2019) the inflation recorded by the Bureau of Labor Statistics (BLS) in their CPI-U index was materially lower at 1.83%. Over estimating inflation results in pessimistic growth rates, and if the BEA's "nominal" data was deflated using CPI-U inflation information the headline growth number would have been higher at a +2.77% annualized growth rate.
Among the notable items in the report :
- Consumer spending for goods was reported to be growing at a +1.67% rate, up +1.52pp from the revised prior quarter.
- The contribution to the headline from consumer spending on services was reported to be +1.17%, up +0.69pp from the prior quarter. The combined consumer contribution to the headline number was reported to be up +2.21pp from the revised prior quarter. This sharply reverses a multi-quarter trend of weakening growth in consumer spending.
- The headline contribution for commercial/private fixed investments was reported to be -0.14%, down +0.67pp from the revised prior quarter.
- Inventories subtracted -0.86% from the headline number, down a substantial -1.41pp from the revised prior quarter. It is important to remember that the BEA's inventory numbers are exceptionally noisy (and susceptible to significant distortions/anomalies caused by commodity pricing or currency swings) while ultimately representing a zero reverting (and long term essentially zero sum) series.
- The contribution to the headline from governmental spending was reported to be +0.85%, up +0.37pp from the revised prior quarter.
- The contribution from exports was reported to be -0.63%, down a substantial -1.28pp from the revised prior quarter.
- And second quarter imports subtracted -0.01% annualized "growth" from the headline number, down -0.31pp from the revised prior quarter.
- The annualized growth in the "real final sales of domestic product" was reported to be +2.91%, up +0.32pp from the prior quarter. This is the BEA's "bottom line" measurement of the economy (and it excludes the inventory data).
- As mentioned above, real per-capita annualized disposable income was reported to have grown by $213 quarter to quarter. For the past quarter the annualized household savings rate was reported to have dropped to 8.1% (down -0.4pp from the revised prior quarter).
The Numbers - All Quarters Revised
As a quick reminder, the classic definition of the GDP can be summarized with the following equation :
GDP = private consumption + gross private investment + government spending + (exports - imports)
or, as it is commonly expressed in algebraic shorthand :
GDP = C + I + G + (X-M)
In the new report the values for that equation (total dollars, percentage of the total GDP, and contribution to the final percentage growth number) are as follows :
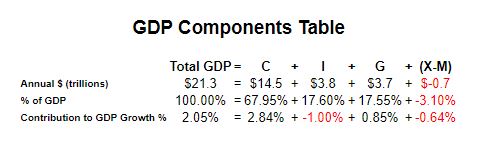
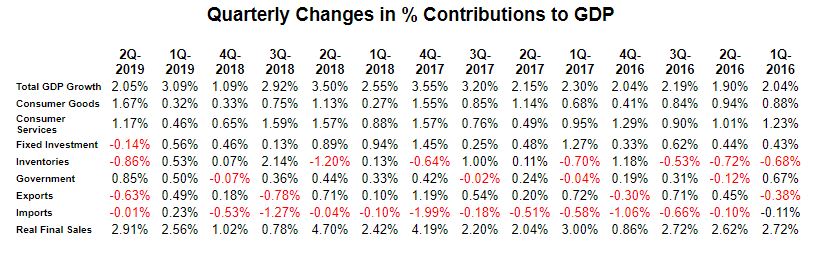
The quarter-to-quarter changes in the contributions that various components make to the overall GDP can be best understood from the table below, which breaks out the component contributions in more detail and over time. In the table below we have split the "C" component into goods and services, split the "I" component into fixed investment and inventories, separated exports from imports, added a line for the BEA's "Real Final Sales of Domestic Product" and listed the quarters in columns with the most current to the left:
Summary and Commentary
We are not quite sure what to make of this new report, primarily because it singularly reverses a number of trends that were very noticeable over the course of the past year. With that in mind, and at face value, the key takeaways from this report for the 2nd quarter of 2019 are as follows :
- The much lamented demise of the consumer sector seems to have been premature. Combined spending on goods and services provided more growth (+2.84%) than the net headline number.
- Commercial spending on fixed investment, which had materially supported the headline number for the past year, slid into contraction.
- Inventories did their "thing" -- flipping sharply into negative territory. This is mean reversion at its very best. But arguably it is the flip side of the improvement in consumer spending. And it brings to mind that inventory draw downs are the ultimate mixed message -- demonstrating caution on the part of inventory holders while simultaneously offering an encouraging long range future to manufacturers.
- Government spending soared, with all of the increase in Federal non-defense spending. This is likely related to a time-shifted hangover from the extended "shutdown" -- although the "shutdown" itself (as expected) resulted in no material reduction in spending.
- Foreign trade also flipped, dropping the headline by -0.64pp after adding +0.72pp in the prior quarter, a -1.36pp swing relative to the prior quarter.
- The BEA's deflator is now substantially higher than the CPI-U reported by the BLS, resulting in an materially more pessimistic growth rate than might otherwise have been reported -- reversing yet another trend.
- The 22 quarters of historic revisions were, as a whole, relatively benign -- averaging an upward +0.02pp per quarter. However the immediately preceding four quarters took a beating, with the 4th quarter of 2018 dropping by a material -1.07pp.
Over the years we have come to expect that the revision process will reduce the growth reported in the relatively recent past. That raises the obvious question: Is the BEA's data collection process naturally biased to optimism on a quarter by quarter basis? Or is it just good bureaucratic policy to bury some of the negative stuff in the revisions that nobody really looks at?
It is plausible that the BEA's survey based approach introduces a short term survivor bias in their reports -- a phenomenon also observed in employment data. Non-responding survey participants are assumed to still be operating, and their prior responses are simply carried forward. Eventually the dead entities get weeded out, but not before the earlier assumptions about them creates a short term survivor bias.
We certainly hope that the bias is procedural, and not bureaucratic policy. And if it is procedural, we might point out that this is the 21st century -- with instant replays and robots calling balls and strikes -- and surely we should expect the BEA to do better.
Disclosure: None.


