
Accounting Gimmicks Won’t Stop The U.S.A. Titanic From Sinking
The U.S. Government has gone to great lengths in using accounting gimmicks to prop up the financial system and domestic economy. One area where this is readily apparent is the disconnect between the rising U.S. debt versus the annual budget deficits.
Mish Shedlock wrote about this in his article, U.S. Deficit at $590 Billion But Debt Up $1.2 Trillion: Sleight Of Hand Magic:
The US deficit is up $590 billion so one might think total US debt would rise by that amount or at least something close to that amount.
Instead, total US debt for the fiscal year that just closed soared by over $1.2 trillion. What’s going on?
The shortest answer is “deficit lies”. The longer answer involves numerous off budget items like social security do not count towards the deficit but do count towards debt.
I calculated the increase of total U.S. debt from 2000 to 2016 as well as the annual budget deficits:
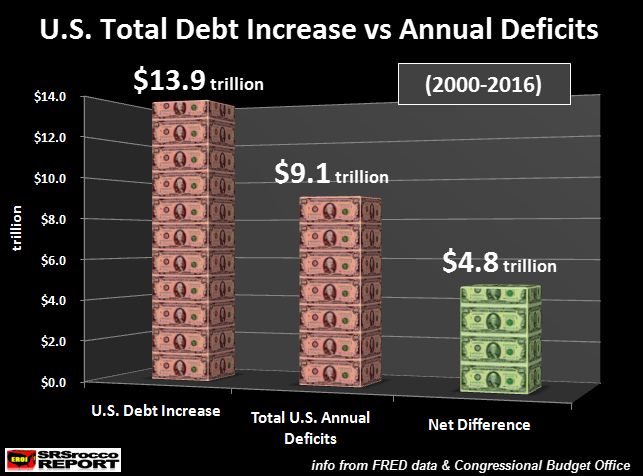
From 2000-2016, the total U.S. debt increased by $13.9 trillion while the annual budget deficits equaled $9.1 trillion. Thus, we had a net difference (or shortfall) of $4.8 trillion. Basically, the total U.S. debt increased $4.8 trillion more than the annual budget deficits during that time period.
So, how could this be? From the article linked above, Hoisington Management stated the following about the increase in debt versus the deficits:
What is interesting to take notice in the chart in the quoted text above, is that the high spike in total U.S. debt versus the annual budget deficit took place during the 2008-2009 U.S. financial and economic crash.However, another large spike took place in 2016 as the total debt increased $1.2 trillion versus $590 billion in the budget deficit.
So, why such a big increase in 2016 if the U.S. economy and stock market is supposedly very strong? Or is the financial situation much worse than we are led to believe?
Well, to get an idea of where we are going, we need to look at how the U.S. Government forecast its budgets in the past. Here is the CBO (Congressional Budget Office) ten-year budget from 2008 to 2017. The excel table below also includes years 2006 and 2007:
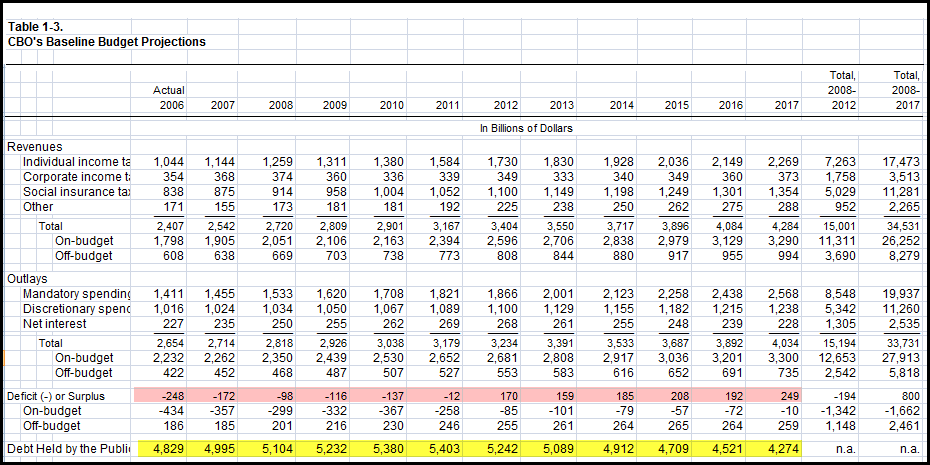
It’s hard to read all the data, but the highlighted RED AREA is the annual deficits or surpluses, and the YELLOW is the debt held by the public. Now, this public debt amount is not the entire U.S. debt, just the public debt. The figures highlighted in YELLOW do not include the “Intragovernmental Holdings.”
For example, in 2006, the total public debt (yellow) was $4.829 trillion. However, the total U.S. Government debt was $8.5 trillion that year. Thus, the Intragovernmental holdings were approximately $3.7 trillion.
So, according to the CBO ten-year budget for 2008-2017, there would be a net surplus of $800 billion (this is all the way to the right of the highlighted yellow line) and the total public debt (minus intergovernmental holdings) would fall to $4.274 trillion in 2017.
So, what really happened? Here is the CBO’s ten-year budget for 2017-2026:
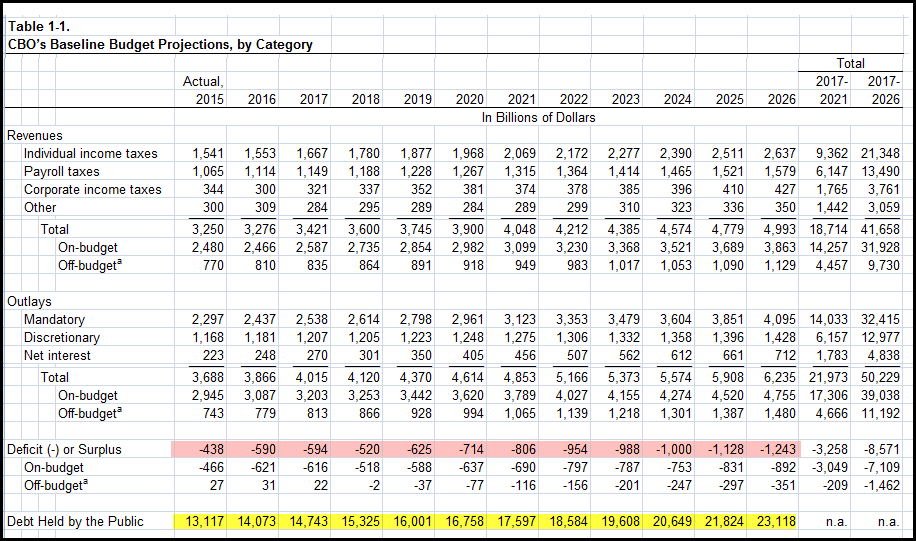
If we look at 2017, the total U.S. public debt is forecast to reach $14.743 trillion. Thus, the CBO blew past their previous 2008-2017 budget by a cool $10 trillion. Again, the CBO forecast that the total public debt would only be $4.274 trillion in 2017, nowhere near the $14.473 trillion they forecast for next year.
Furthermore, the CBO forecasts the cumulative deficits will be an additional $8.571 trillion from 2017-2026 (this is all the way to the right of the yellow highlighted line).
Let’s put the CBO ten-year budget forecasts into perspective. According to their 2008-2017 budget made in 2007, they forecast the total public debt would fall from $4.995 trillion in 2008 to $4.274 trillion in 2017. It didn’t. Instead it is forecast to jump by $10 trillion to $14.743 trillion in 2017. Again, the CBO understated the rising public debt by $10 trillion.
Moreover, the CBO forecast that the U.S. government would enjoy a $800 billion net surplus from 2008-2017. Instead, the net annual deficits from 2006 to 2016 accounted to over $8 trillion. So, they blew past that by almost $9 trillion. We get that $9 trillion figure by adding the $800 billion surplus to the $8 trillion deficit.
If the CBO got their ten-year budget from 2008-2017 off by $10 trillion in public debt and $9 trillion in cumulative annual deficits, how much will their 2017-2026 budget forecast be off by?
The CBO forecasts $9 trillion more in public debt by 2026 and $8.5 trillion in cumulative annual deficits. In all likelihood, their forecast will be off by at least 50%, or more.
Again, total current U.S. debt is $19.9 trillion. This includes $14.4 trillion in public debt and $5.5 trillion in Intragovernmental Holdings. If the CBO is budgeting $23 trillion in just public debt, we can add another $6-7 trillion for Intragovernmental Holdings, for a total of $30 trillion by 2026. But, wait… they are probably going to be off by at least another $10-$15 trillion
What kind of interest on the debt would it be if U.S. total debt reached $40 trillion?
Actually, I doubt we are going to make it that long. If you have been reading my energy analysis, the wheels fall off the economy well before 2026. And in all likelihood, the sinking of the U.S.A TITANIC will probably take place during President-elect Trump’s administration.
Lastly…there seem to be many disillusioned precious metals investors who are throwing in the towel due to the supposed Trump Kool-Aid. This doesn’t surprise me one bit. It takes a special person to stick to their guns when the going gets rough.
While the U.S. debt will continue higher, along with the broader stock markets, trying to time the EXIT STRATEGY will be the worse mistake anyone can make.
Disclosure: None.


Steve, great article, Thnx.! Gov't relies on con't sleight of hand for ops to continue. CPI calc changed 8 times since 1980, though we know that energy/food are excluded, how is inflation so low when rents are at all time highs.? And why isn't healthcare, the single greatest tax, included.? BLS figures are, again, another sleight of hand, as a 4.6 UR is massively misleading, for reasons we all know: work 1hr a week and a job has been created, yet no weighting on PT v FT. Similar to ludicrous manner in which the Dow is weighted. In the end, misleads run amuck, which gives our career poliicians plenty of time to kick the can, then blame the other party as the 'grass is greener' public cont's to bounce back and forth between each political party looking for a resolution. One that'll never come, as their pensions slowly erode
I agree with you Jim, that rent is high in cities, while other items are much cheaper than in the past. Energy is cheaper, gasoline, and food are not too bad compared to increases in the past. So, there is little inflation throughout the economy, but real estate asset inflation is disturbing.
I don't believe that social security should count against the deficits. JMO, Steve. I also believe that Japan has shown that the central bank can neutralize fiscal debt. I support helicopter money or the 100 year bond, as a way of circumventing immediate debt.
Gary, why do you feel that way.? If they were to, it would force the gov't to address it. There is no current accounting principle that not only forces them to address it, there is nothing in place to force politicians to address their constituents in regards to it.