
2021: The Year In Charts

Photo by Clay Banks on Unsplash
Here are the charts and themes that tell the story of 2021…
I. The Free Money Effect
In the first few months of 2021, hundreds of millions of Americans (the vast majority whom had never lost a job during the pandemic) received two more tax-free stimulus checks, setting the stage for one of the greatest booms the world has ever seen.
What we learned in 2020 from the first round of stimulus was only amplified in 2021.
And that is this: if you give the American people free money…
-some will spend it,
-some will invest it,
-and others will speculate on memes with it.
During the course of 2021, we saw each of these themes play out, with a rippling effect across markets and the economy.
II. The Definition of Inflation
The impact of the stimulus on the American consumer was nothing short of remarkable, with retail sales surging 22% above pre-covid levels in just 15 months (Jan 2020 – Apr 2021). That increase was more than the sales growth in the previous 5 years combined.
(Click on image to enlarge)

Surging consumer demand coupled with supply chain shortages laid the foundation for the classic definition of inflation: “too much money chasing too few goods.”
This phenomenon played out everywhere you looked, from the gas pump to the supermarket. Here’s a breakdown of price increases from December’s CPI report:
- Fuel Oil: +59.3%
- Gasoline: +58.1%
- Used Cars: +31.4%
- Gas Utilities: +25.1%
- Meats/Fish/Poultry/Eggs: +12.8%
- New Cars: +11.1%
- Overall CPI: +6.8%
- Electricity: +6.5%
- Food at home: +6.4%
- Food away from home: +5.8%
- Apparel: +5.0%
- Transportation: +3.9%
- Shelter: +3.8%
Overall, US inflation rose from a benign 1.4% at the start of the year to an alarming 6.8% at the end, the highest we’ve seen since 1982.
(Click on image to enlarge)

And by all accounts, this was understating the true inflation rate, as the distorted CPI methodology showed a meager 3.8% increase for “shelter” (the largest single component of CPI at 33% of the index).
What was the actual increase in the cost of housing?
Much, much higher.
Rents in the U.S. rose 18% (the highest rate of increase ever) while home prices rose 19% (also the highest rate of increase ever).
(Click on image to enlarge)

Additional upward pressure on consumer prices came from rising wages, with US average hourly earnings increasing 4.8% in the last 12 months.
(Click on image to enlarge)

Nearly every major corporation (Amazon/Walmart/Costco/McDonald’s/Starbucks/Bank of America/etc.) has announced pay hikes and increased benefits for their employees.
What was the impetus pushing wages and benefits higher?
Supply and demand.
The number of job openings in the US currently exceeds the number of unemployed persons by over 4 million, a record high.

Help wanted signs were everywhere, and employers had to increase wages to incentivize workers to reenter the labor force.
An additional factor impacting supply was the percentage of workers who were quitting their jobs, which hit an all-time high during the year (3%). After three rounds of stimulus checks, employees had additional savings and the ability to leave a job they don’t like in search one that they do. This put added pressure on companies to increase pay and benefits in an attempt to retain workers.
(Click on image to enlarge)

As wages are the biggest expense for most companies, a choice had to be made. Either accept lower profits or raise prices of goods/services, passing on the cost to the end consumer.
What did companies do? The latter, and more than enough to offset higher costs.
Earnings of S&P 500 companies hit record highs in each of the first three quarters of 2021, with profit margins expanding to record highs as well.
(Click on image to enlarge)

III. Everything is Transitory
One might assume that with the mountain of inflationary evidence throughout the year there would be no denying its existence. But in meeting after meeting, the US Federal Reserve did precisely that, with Jerome Powell famously saying:
“We will not raise interest rates pre-emptively because we fear the possible onset of inflation. We will wait for evidence of actual inflation or other imbalances.”
Apparently, the highest inflation rate since 1982 did not qualify as “actual” inflation, because at year-end the Fed Funds Rate stood at exactly the same place it started: 0%.
That translated into a real (inflation-adjusted) Fed Funds Rate of -6.7%, the lowest in history with the exception of December 1974.
(Click on image to enlarge)

Up until the very last meeting of the year, the Fed took a dismissive stance on rising prices, saying it’s just “transitory” and therefore can be safely ignored.
But in December, they seemed to finally realize the ridiculousness of that position, abandoning the “transitory” moniker while hastening the tapering of asset purchases.
But the damage was done, and the Fed’s credibility as an inflation-fighting institution (1/2 of their dual mandate) has been severely damaged. In a year in which inflation rose to 40-year highs, they not only held rates at 0% but purchased an additional $1.39 trillion in Treasury and mortgage bonds.

Why would they do such a thing?
To monetize the skyrocketing debt load and attempt to keep inflated asset prices from deflating.
Speaking of debt, how did we pay for all of that stimulus?
We borrowed it, of course. US national debt ended the year at $29.6 trillion, more than $6 trillion higher than where it stood just two years earlier.

The Fed was a buyer of a good portion of that new debt, with an expansion of their balance sheet to over $8.7 trillion, more than double pre-covid levels.
(Click on image to enlarge)

IV. Rolling Manias
The combination of easy monetary policy and free stimulus checks boosted investor sentiment to levels we haven’t seen since the dot-com bubble and was the perfect backdrop for a mania to take place. Instead just one, though, we saw many.
Just a few of the highlights…
- Bitcoin (BTC) rose to over $64,000 by mid-April, more than double where it started the year. It peaked at over $68,000 in November with a market cap of over $1.2 trillion.

- In early May, meme-fueled Dogecoin (DOGE) rose to a market value of $87 billion, higher than 408 companies in the S&P 500. This was an increase of over 11,000% from where it entered the year.
(Click on image to enlarge)

- Averaging more than a billion a day, SPAC IPOs became all the rage, surpassing their record 2020 issuance by mid-March. At the height of the mania, it seemed like every celebrity and famous athlete was sponsoring a SPAC. During the full year, 613 SPACs came to market, at a total issuance of $162 billion. If we include traditional IPOs as well, this number jumps to $316 billion, by far the largest we’ve ever seen.
(Click on image to enlarge)


- Meme stocks became a cultural phenomenon, propelled by retail investors on Reddit (r/wallstreetbets) squeezing the heavily shorted Gamestop (GME). At one point near the end of January, Gamestop had risen to a market cap of $35 billion, which was 27x higher than where it began the year.

- Another favorite among Reddit traders, AMC (AMC), surged to a market value of $33 billion in early June, a 70x increase from the start of the year.

- One of my personal favorites was the 12,000% rise in Signal Advance (SIGL), which surged on the mistaken belief that it was a messaging company (Signal) referenced in a tweet by Elon Musk.
(Click on image to enlarge)

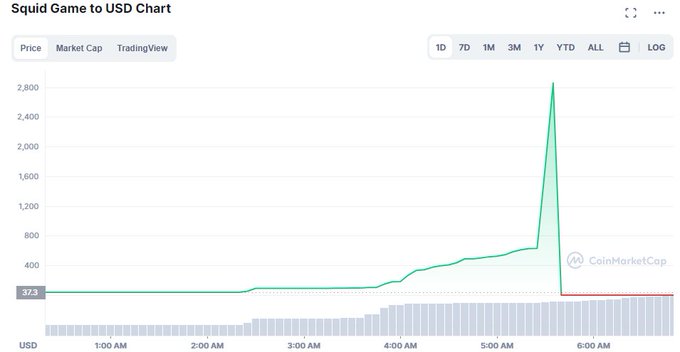
- Last but not least, in the early morning of November 1st, we saw a speculative rise for the ages in the recently invented recently invented Squid Game crypto coin (no financial relationship to the hit Netflix show). Over the course of a few hours, the coin rose from $38 to $2,856, a 75x increase.
V. The Other Side of a Mania
In the midst of a mania, it can seem as if the “voting machine” is all that will ever matter, and you can safely throw caution to the wind. But the “weighing machine” is always lurking in the background. Speculators would learn this lesson time and again throughout 2021…
- The case of mistaken identity, Signal Advance SIGL, gave back all of its gains and more…
(Click on image to enlarge)

- Just fives minutes after Squid Game coin peaked at $2,856, it would crash to nearly $0 and be exposed as a fraud.
- The SPAC boom was a bust for most investors, with the SPAC ETF (SPAK) ending the year down 25% after a 40% decline from its February high.
(Click on image to enlarge)

- Dogecoin peaked shortly after Musk brought his long-running parody/promotion of the coin to Saturday Night Live. It finished the year 78% below its high.
(Click on image to enlarge)

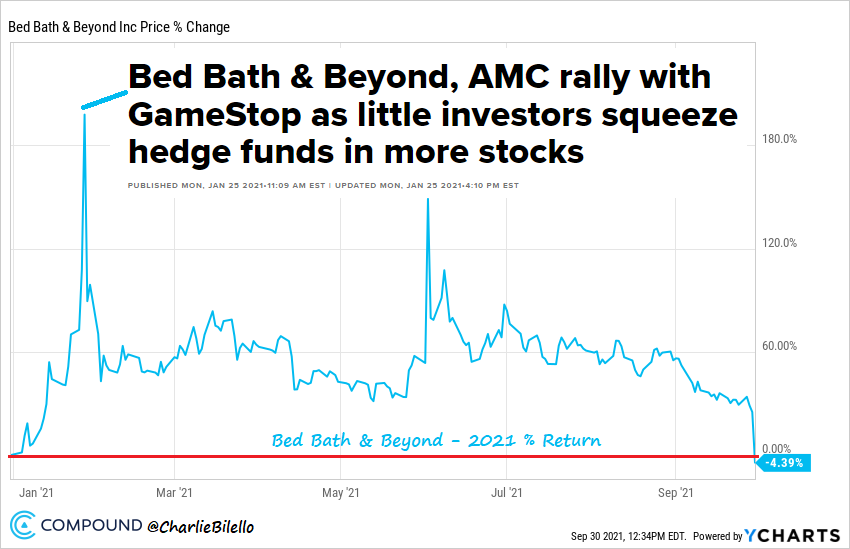
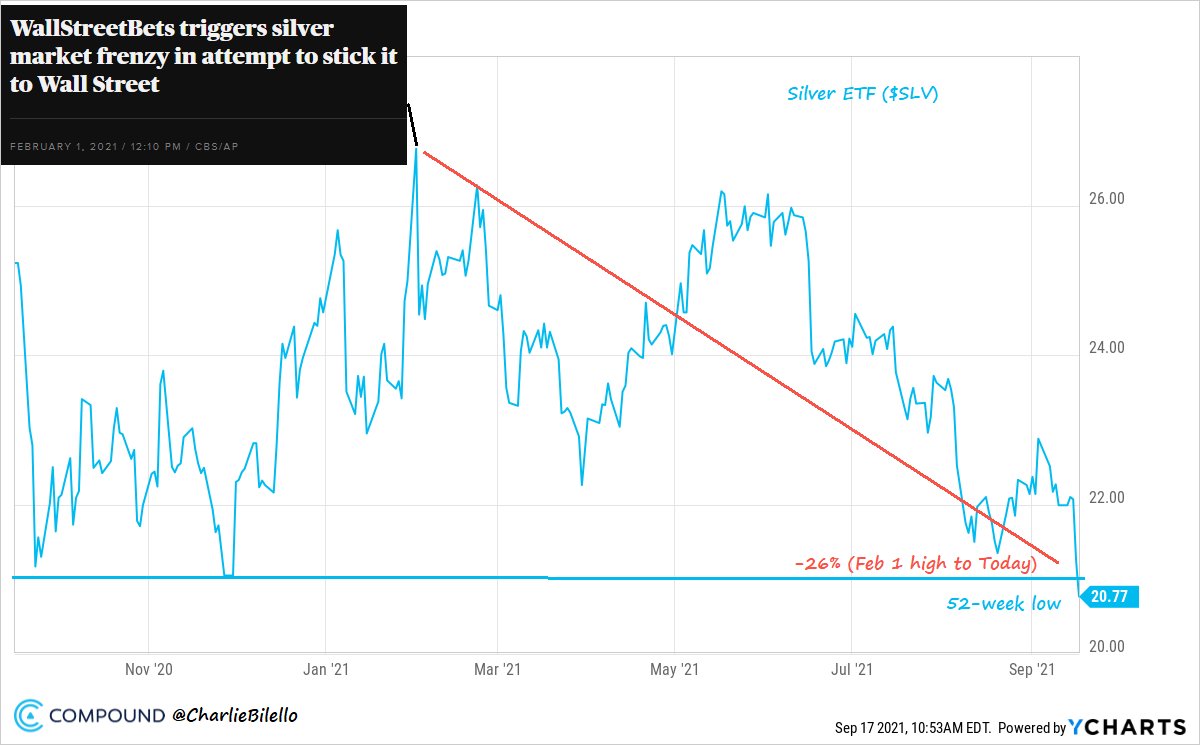
- As for the “meme” stocks, most gave back all of their gains and more, including Clover Health (CLOV), Bed Bath & Beyond (BBBY), Tilray (TLRY), Beyond Meat (BYND), and the Silver ETF (SLV).
(Click on image to enlarge)


- What about the king and queen of memes, GameStop (GME), and AMC (AMC)? Both are down over 60% from their 2021 highs…

The lesson for investors: on the other side of every mania lies the reality of the weighing machine. It was always there, lurking in the background, but in the midst of a parabolic, sentiment-driven advance, nothing could seem more irrelevant.
In 2021 we saw this story play out in one mania after another. And as long as human beings and their emotions are involved in markets, we’ll see plenty more in the years to come.
VI. Bull or Bear Market?
Are we in a bull market or a bear market?
Looking at any of the major U.S. equity indices last year, that question seems ridiculous.
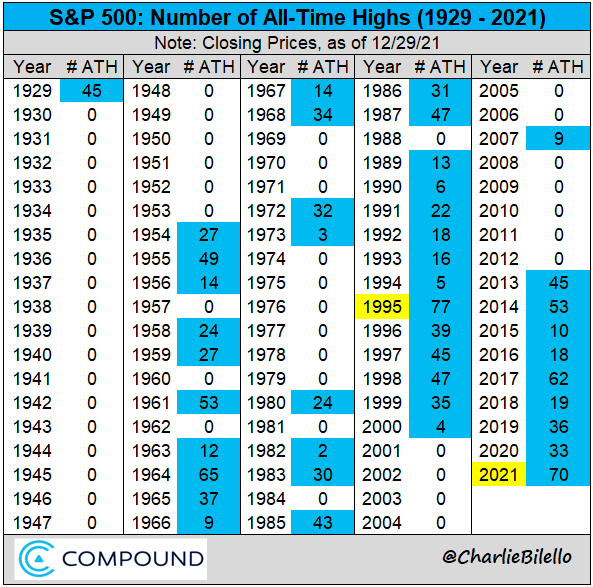
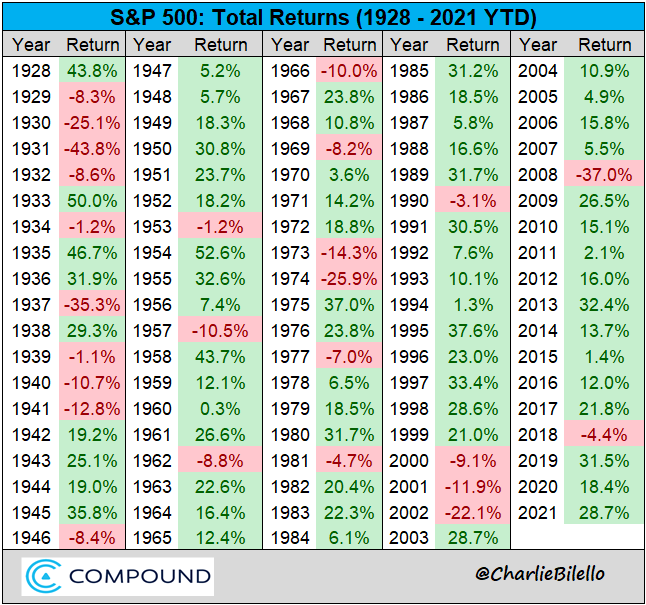
The S&P 500 finished up 29% on the year, hitting 70 all-time closing highs, the second most of any year in history (only 1995 had more).
(Click on image to enlarge)

And it achieved these gains with remarkable calm, a maximum drawdown of only 5.2%.
(Click on image to enlarge)

So case closed, then, it’s a bull market?
Not so fast.
If we dig a bit deeper, we find something very interesting.
While the S&P 500 ended the year only 0.6% below its all-time high, the average Russell 3000 stock was 36% below its all-time high. Incredibly, over 60% of Russell 3000 stocks are 20% or more below their all-time highs.
Many high growth names that were investor favorites in 2020 (Peloton/Zoom/Penn/etc.) are on this list, having the opposite experience in 2021…
(Click on image to enlarge)

How could that possibly happen with the major indices having one of their best years ever?
The indices are weighted by market capitalization and the influence of the largest stocks has been growing rapidly in recent years. The top five holdings in the S&P 500 (Apple, Microsoft, Google, Amazon, and Tesla) now represent over 23% of the index, the highest concentration we’ve seen in recent history.
(Click on image to enlarge)

Apple’s nearly 7% weighting in the S&P 500 is the largest weighting any individual stock has held in the last 40 years (data goes back to 1980).
And Apple had another great year in 2021, rising 34.7%, with its market cap approaching $3 trillion. The second and third largest companies, Microsoft and Google, did as well, gaining 52.5% and 65.3%.

So, is this a bull or a bear market?
That depends entirely on the portfolio of the beholder.
If you’re solely a U.S. market-capitalization index investor, it’s still a raging bull market.
But if you’re invested in any number of other securities (ex: high growth stocks (ARKK ETF), recent IPOs (IPO ETF), recent SPACs (SPAK ETF), or Chinese equities (MCHI or KWEB ETFs), it’s most definitely a bear.
(Click on image to enlarge)

VII. Bond Market Blues
Speaking of bears, the rise in yields during 2021, meager as it was, led to one of the worst years ever for bonds (-1.5% for Barclays US Aggregate).

The 10-year yield ended 2021 at 1.52%, an increase of 59 bps from where it began (0.93%). Overall, we saw rising treasury yields across all maturities from 6 months through 30 years.

The surprise, however, was not that bond yields rose, but that they rose by such a meager amount given the sharp move higher in inflation (CPI rising from 1.4% to 6.8%). The result: the lowest real yields we’ve ever seen.
(Click on image to enlarge)

This situation, however, is not likely to last very long. Either yields will rise, inflation will fall, or some combination of the two.
That’s already starting to happen at the shorter end of the curve, with investors now anticipating at least 3 Fed rate hikes by the end of 2022.
(Click on image to enlarge)

Most of the world is ahead of us on that front, having a greater fear of the rising inflation that has become a global phenomenon.

The great normalization of central bank policy has already begun, with 2021 rate hikes in the UK, Norway, New Zealand, South Korea, Poland, Peru, Colombia, Czech Republic, South Africa, Chile, Mexico, Russia, and Brazil. The US will soon join this list.

VIII. A Change in the American Psyche
At the start of 2021, Americans had never been more united on one issue: the belief that there was absolutely no downside to borrowing from our children’s and grandchildren’s future so that we could spend more money today.

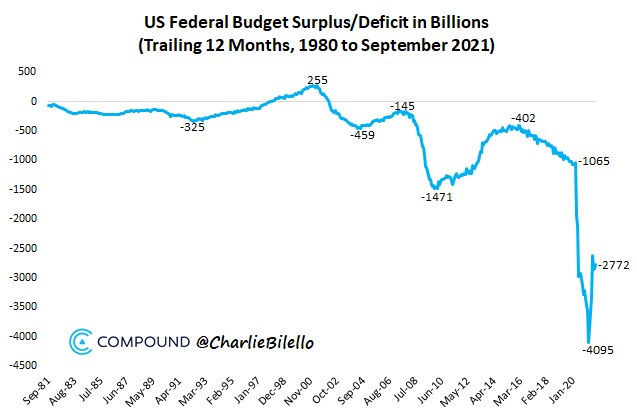
And so borrow and spend we did, with a $2.77 trillion budget deficit in the 2021 fiscal year, the 2nd largest in history after after 2020.
Were there any concerns that these actions would have negative repercussions?
Not many. Memories of the inflationary spiral in the late 1970s and early 1980s had long faded, and the younger generations were not fazed one bit by the prospect of higher prices.
But as the year progressed, and inflation rose month after month, we witnessed a dramatic shift in the American psyche. Many people were now questioning whether additional stimulus/borrowing/spending is the right course of action.
As a result, the nearly $2 trillion “Build Back Better” plan has been put on hold, with moderate Democratic Senator Joe Manchin from West Virginia saying the following:
“If I can’t go home and explain it to the people of West Virginia, I can’t vote for it. And I cannot vote to continue with this piece of legislation. I just can’t.”
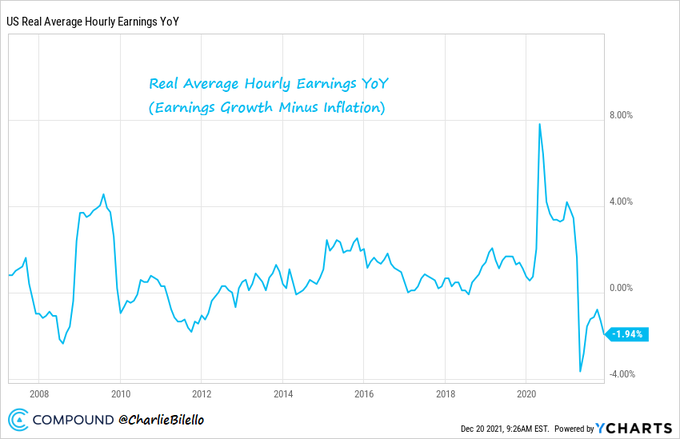
What was the issue? The people of West Virginia are experiencing the harmful effects of inflation firsthand, and they’re not alone. Rising prices are now outpacing the increase in American wages, lowering our purchasing power and standard of living.
To be sure, this is not to say we’re going to see a balanced budget any time soon. The debt ceiling has been lifted and we’re already at $29.6 trillion, with $30 trillion a certainty in the coming months.
But the idea that we can borrow and spend whatever we want with no negative consequences has been proven demonstrably false. “Free money” isn’t free. There’s a cost to everything, even if you can’t see it at first.
IX. From Pandemic to Endemic: Learning to Live with Covid
One by one, countries around the world are slowly coming to terms with what epidemiologists have said since the start of the pandemic: zero covid-19 is an impossible and unrealistic goal; we’re not going to eradicate it.
The reality is that the latest variants (Delta and Omicron) are simply too contagious to contain without enacting draconian measures that would only delay the inevitable and cause significant and irreparable harm.
The virus instead will become endemic, having less and less of an impact on society, and people will learn to live with it.
That’s already happening (one ex: US airline travelers averaged 1.9 millions/day in December 2021, more than double December 2020’s average of 850k/day), and for a few very good reasons.

First, we now have vaccines that have been shown to greatly reduce the risk of hospitalizations and deaths. As the percentage of the world’s population that is vaccinated continues to grow, this will have more and more of an impact.

Second, we have naturally acquired immunity that also greatly reduces the severe illness upon reinfection. My estimate is that nearly 60% of the US population has now been infected with the virus, and that number is rising fast during the current wave.
Third, we have known since early in the pandemic that the risk of death from covid is not linear but instead increases exponentially with age. The risk to an 8-year-old is not remotely in the same universe as an 80-year-old (80-year old fatality rate is 3,750x higher), and as such we should not expect their behaviors to be the same.

Lastly, we have an increasing number of data points that suggests that the highly transmissible Omicron variant is also significantly less severe, both in terms of hospitalizations and deaths.
So while the virus will always be with us, that doesn’t mean that we can’t still live our lives, particularly when the risk of severe disease for the vast majority of the population is extremely low and getting lower every day. I’m hopeful that in 2022 we can learn to live with covid and give people back the freedom to live their lives and assess their own risk.
This chart illustrates the wonderful global divergence between cases and deaths that will hopefully continue in the new year…

X. Triumph of the Optimists
In some respects, we left 2022 in the same way we started it: with stock prices at all-time highs, home prices at all-time highs, and an easy money policy at the Fed.
But there’s always change, and the most important in 2021 was the renewed human spirit. People began to live their lives again: eating out at restaurants, traveling, attending live events, and spending in-person time with family and friends.
The S&P 500 would finish the year up 28.7%. It has now ended higher in 12 out of the last 13 years and 17 out of the last 19. Over the last 3 years, the S&P 500 has more than doubled (+100%), its highest 3-year return since 1997-1999.
At a level of 3756, the S&P 500 ended the year above every single Wall Street forecast.

Volatility was muted, with the VIX falling back to pre-pandemic levels.
(Click on image to enlarge)

The three minor 5% pullbacks in the S&P 500 were all short-lived, with the market quickly rallying back to new highs.
(Click on image to enlarge)

The Nasdaq 100 Index gained 27%, extending its record streak of annual gains to 13.

The Dow finished up 21% on the year, with 24 out of 30 components in the green.

All 11 S&P 500 sectors finished with double-digit % gains in 2021. The 3 worst performing sectors in 2020 (Energy, Real Estate, Financials) were the 3 best performers in 2021…

In a reversal of 2020, many of the best performing S&P 500 stocks were in these sectors, including the top two (Devon Energy and Marathon Oil).
(Click on image to enlarge)

A majority of country ETFs finished positive in 2021 (median return of 10%), with US shares outperforming once again.
(Click on image to enlarge)

As economies reopened and stimulus measures took hold, global growth rates rebounded sharply throughout the world.
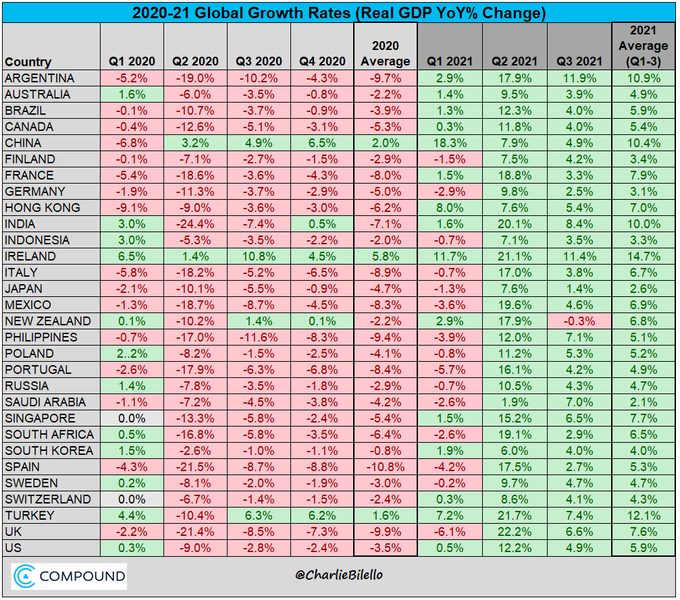
The US economy fully recovered by the 2nd quarter of 2021 and is on pace for its highest annual growth rate since 1983 (+6% real GDP).

The US Unemployment Rate fell sharply throughout the year, down to 4.2% at year-end. This is now well below the historical average of 5.8%.

With the rise in growth and employment came rising yields, which hurt segments of the bond market most sensitive to duration (TLT/ZROZ). The standout performers within bonds were inflation-protected securities (TIP), rising 5.7%.

Junk Bonds also finished higher (HYG +3.7%) with an all-time low in yields hit during the year (3.92%) and credit spreads tightening to their lowest levels since 2007 (3.01%).
(Click on image to enlarge)

The housing boom in the US accelerated (+19% YoY), with all-time highs in the national index and every major metropolitan area experiencing double-digit % gains.
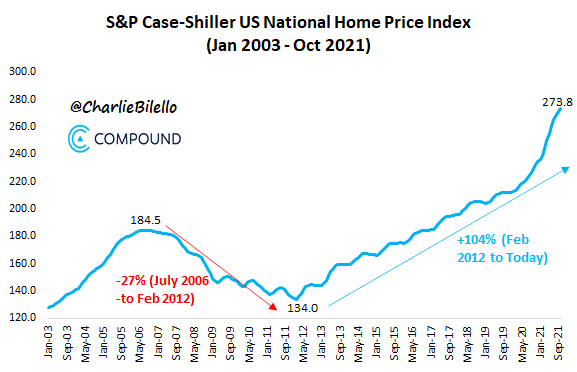
(Click on image to enlarge)

With the exception of Gold (-4%) and Silver (-12%), most Commodities finished sharply higher on the year, led by Coffee’s 76% gain.

The Bloomberg (+27%) and S&P GSCI (+37%) Commodity indices both had their best year ever.
(Click on image to enlarge)

And last but not least there was Crypto, with many of the most popular coins showing unbelievable gains. The total market value of Crypto ended the year at $2.26 trillion, 129x higher than where it stood five years earlier ($17.5 billion at the end of 2016).

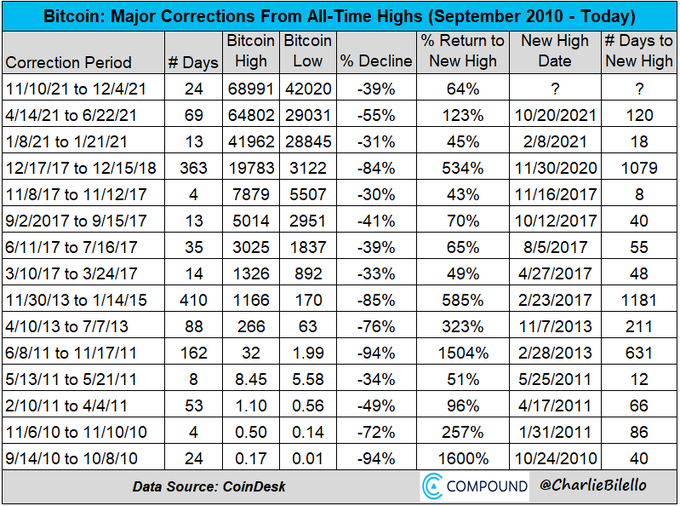
While many of the major risky assets did well, there can be only one King, and in 2021 the crown went to Bitcoin once again.
(Click on image to enlarge)

But that crown does not come without thorns, as there is no reward without risk. Here are the largest Bitcoin corrections over the years, including 3 more in 2021…
The TL;DR recap of 2021…
- Pandemic: slowly moving to endemic state with combination of vaccine/natural immunity and milder Omicron variant significantly lowering the odds of severe outcomes
- Economy: v-shaped recovery, unemployment rate plummeting, strongest real GDP growth since early 1983
- Inflation: highest since early 1980s, not proving to be transitory
- Stocks: more all-time highs (70) than any year except 1995. Stealth bear market in high growth/china/SPACs.
- Junk Bonds: all-time low in yields, spreads back to 2007 levels
- Treasury Bonds: yields slowly rising, but much less than the rise in inflation
- Housing prices: all-time highs with record increases over the last year
- Commodities: strong gains with the exception of gold/silver, best year overall in a long time
- Central Banks: Fed still easy but taper has begun and 3 hikes are now expected in 2022; most central bank have already started normalizing policy with more to come
- Bitcoin: volatile as always (3 corrections >30%) but still beat all major asset classes
In a year filled with many challenges and things to be worried about (as is always the case), it was a triumph of the optimists once more.
XI. Happy New Year
These were the charts and themes that told the story of 2021. As always, the narratives followed prices.
As prices change in 2022, the narratives will change as well.
- Where will the S&P 500 end 2022?
- How about the 10-Year Yield?
- Where is Crude Oil headed?
- Is Gold or Bitcoin a better investment today?
- How many times will the Fed hike rates?
- Will higher inflation persist?
- When will the next recession occur?
I don’t know the answer to any of these questions.
As Lao Tzu said, “those who have knowledge don’t predict. Those who do predict don’t have knowledge.”
What’s the alternative?
Weigh the evidence as it comes, invest based on probabilities, be forever humble and thankful, and leave the predictions to those whose job it is to entertain. That’s the best you can do in this fickle business of investing – try to find the right path for you and stick with it long enough to reap the enormous benefits of compounding.
In 2022, I predict one thing and one thing only: you will see many more surprises. That is the nature of markets.
Disclaimer: All information provided is for educational purposes only and does not constitute investment, legal or tax advice, or an offer to buy or sell any security. For our full ...
more

