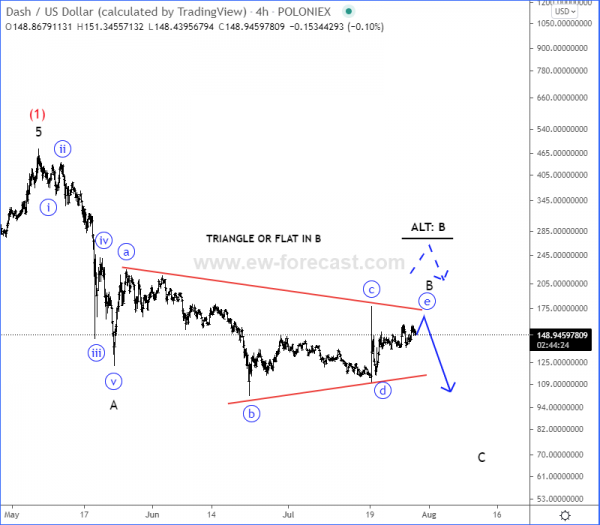
DSHUSD Elliott Wave Analysis - Looks To Slide Down
- Crypto Currencies trade intraday resistance
- DSHUSD finishes wave "e"
- Be aware of dropbacks to lows
Cryptocurrencies are still trading intraday resistance within a five-wave cycle for wave C, except for DSHUSD who can be finishing wave "e", so watch out for a reversal down, now that we are approaching the end of week and month.
As per Elliott Wave analysis Despite that recent spike, DSHUSD can be still looking lower for wave C, but ideally, once a bearish running triangle in wave B fully unfolds, where the final wave "e" can be now in play So, be aware of that drop back to lows for wave C before we will see a bigger recovery. However, just in case it rises back above 200 area, then we may still consider an irregular flat correction in wave B as an ALTernate count that can retest 200-250 resistance zone.
DSHUSD 4h Elliott Wave Analysis Chart

Disclosure: Please be informed that information we provide is NOT a trading recommendation or investment advice. All of our work is for educational purposes only.


The "Elliot Wave " is an interesting analysis tool and it seems that some are able to apply it and get usable results. But is it an actual formula, or is it more an evaluation method based on a lot of history? Or is the derivation much more of a secret?
I think we are going to bounce between $160-$180 before we actually take off, I see this idea but we just came out of a wedge.