Dow Futures Doing Elliott Wave Corrective Pullback
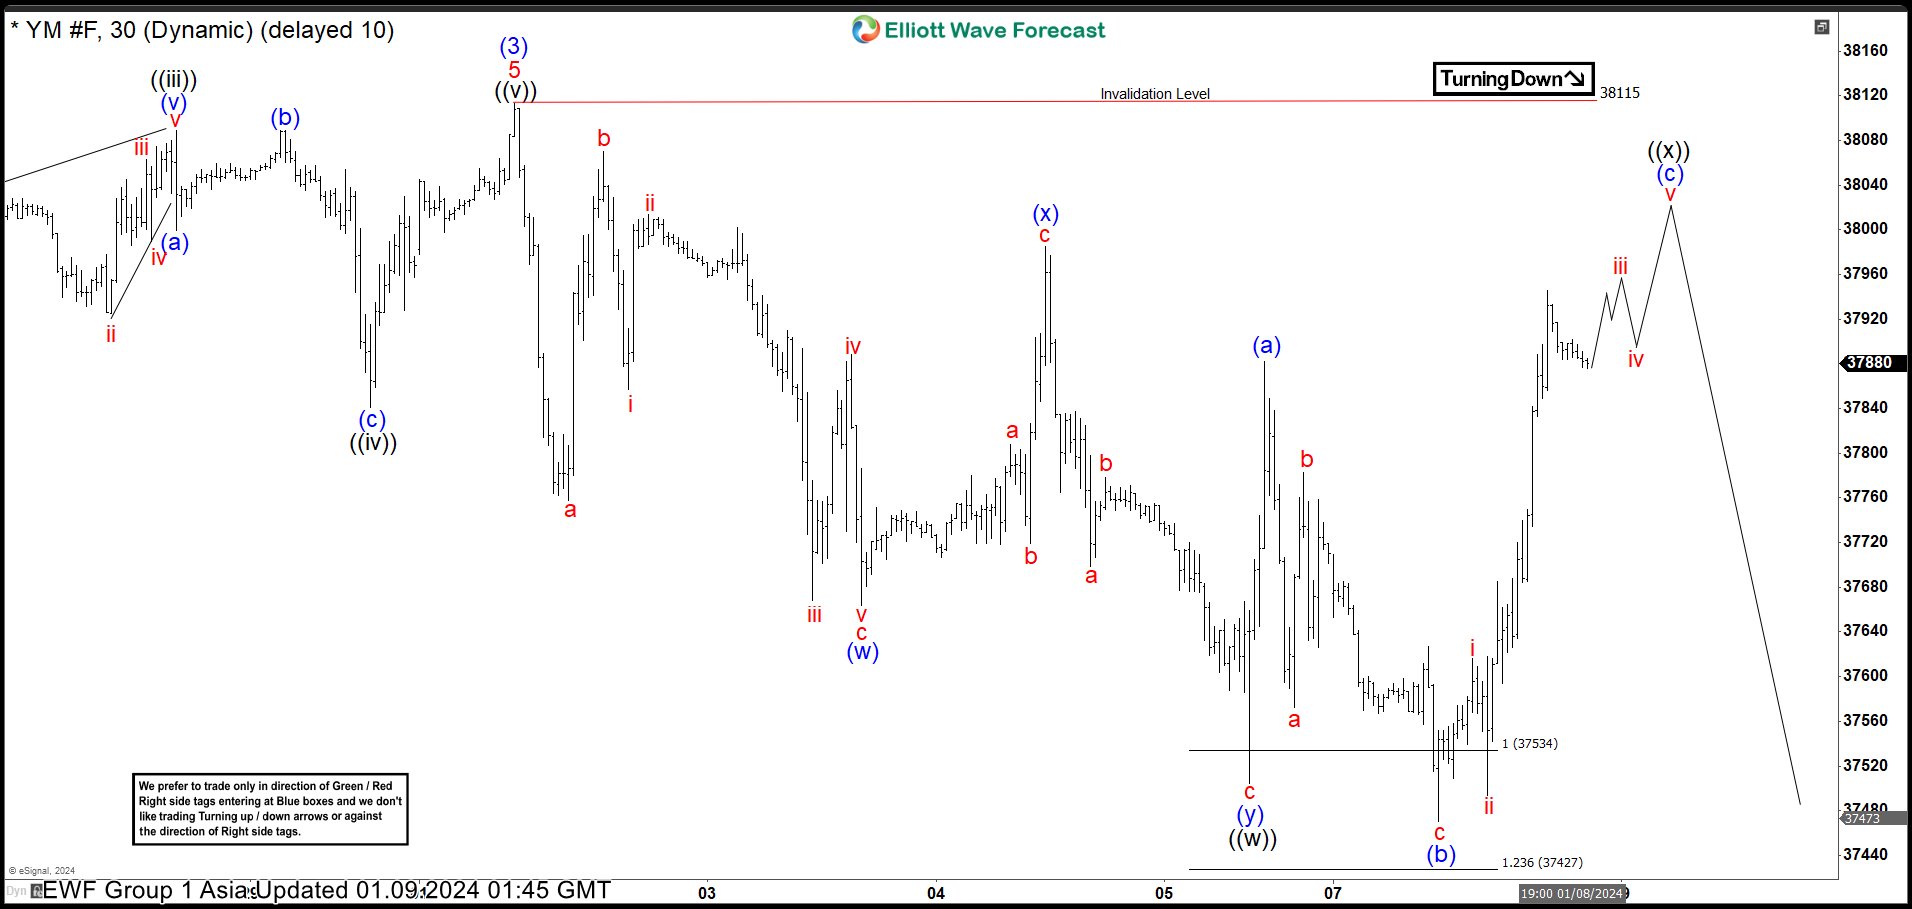
Short-term Elliott Wave View in Dow Futures (YM) suggests that the rally to $38115 high has ended the cycle from the 10.27.2023 low in wave (3) as 5 wave impulse structure. Down from there, the index is doing a corrective pullback in wave (4) against the October 2023 low cycle. And is expected to find buyers in 3, 7, or 11 swings looking for more upside. We will explain the forecast in 30 Minutes chart below:
Down from $38115 high the index is doing a corrective pullback when the initial decline to $37664 low ended wave (w) in a lesser degree 3 wave. Then a bounce to $37985 high ended wave (x) in another 3 waves. Below from there, the (y) leg lower ended at $37504 low after reaching the extreme area at $37534- $37427 area. Thus completed wave ((w)) as a double correction. Since then, the index is doing a short-term bounce in wave ((x)) as the Elliott wave expanded flat correction. Whereas small wave (a) ended at $37882 high. Wave (b) ended at $37470 low and wave (c) is expected to fail against $38115 high.
Dow Futures (YM) 30 Minutes Elliott Wave Chart
(Click on image to enlarge)
More By This Author:
EURJPY : 1:2.5 Risk/Reward Target HitAT&T One More Low Is Expected to Complete a Bearish Sequence
Exxon Mobil Corp Found Buyers From Extreme Area
Disclaimer: Futures, options, and over the counter foreign exchange products may involve substantial risk and may not be suitable for all investors. Leverage can work against you as well as for ...
more


