Dogecoin And Shiba Inu: Dogecoin At 0.15000 Support Level
Dogecoin chart analysis
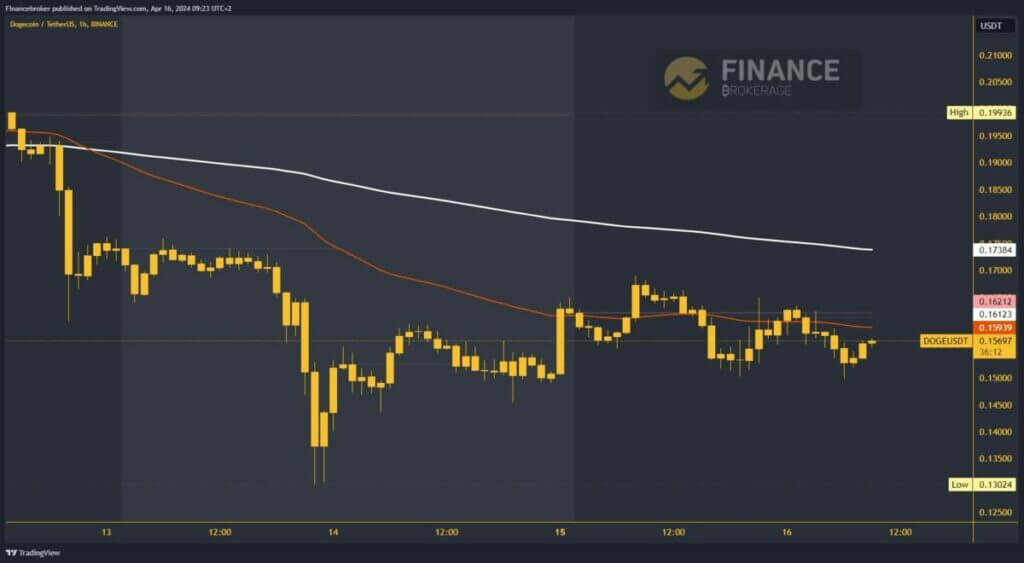
Over the weekend, the Dogecoin price dropped to the 0.13024 level. With that, we fell to a new April low, after which we managed to get that support. On Sunday, the price rose above 0.15000, where it formed the bottom, from which a bullish impulse followed to 0.16500 by the end of the day.
On Monday, we climbed to 0.16900, where we encountered resistance. The Dogecoin price starts to pull back from that level, returning and testing the 0.150000 level again.
For now, we remain above and believe we will see another bullish consolidation. Moving above 0.16500, we get support from the EMA50 moving average. Potential higher targets are 0.17000 and 0.17500 levels. We need a break below the 0.15000 support level for a bearish option.
With that, we go to a new daily low and confirm the bearish momentum. Potential lower targets are 0.14500 and 0.14000 levels.
(Click on image to enlarge)

Shiba Inu chart analysis
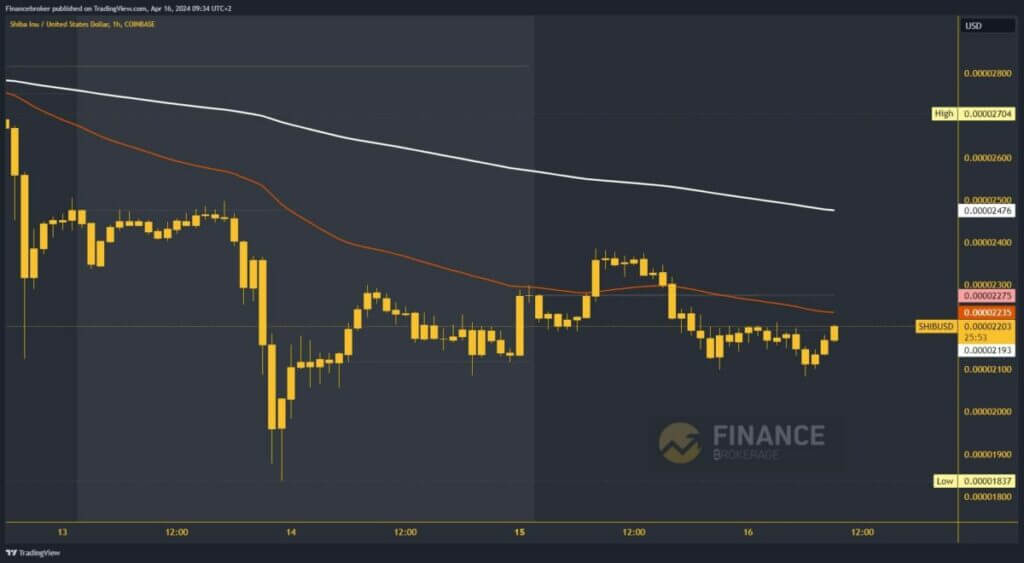
On Saturday, the Shiba Inu price retreated to 0.00001837 levels. We fell to a new multi-week low. After that, we get support at that level, and by the end of the weekend, we recover to the 0.00002300 level. On Monday, we climbed to the weekly high at 0.00002386, where we have resistance.
This caused us to start pulling back to support at the 0.00002100 level. For now, we are above that level and trying to initiate a new bullish consolidation.
We need to go back to 0.00002300 again; with that, we would jump over the EMA50 moving average. With his support, it will be quite easy for us to start a further recovery on the bullish side. Potential higher targets are the 0.00002400 and 0.00002500 levels. We will have a new additional resistance in the zone around 0.00002500 in the EMA200 moving average.
(Click on image to enlarge)

More By This Author:
Xiaomi’s Bold Move Into China’s EV LandscapeNvidia’s Potential To Double By 2029
U.S. Growth’s Impact On World Stability
Disclaimer: Information on this article contains forward-looking statements that involve risks and uncertainties. Markets and instruments profiled on this page are for informational purposes ...
more


