
Does Gold Have A Green Light To $1700?
Gold just doesn’t seem to care and is stubbornly ignoring its inverse relationship with the USDX. What accounts for gold’s current downward trend?
It’s really hard to get a more bearish combination of factors for gold than what we just saw.
A good way to start the discussion would be to reply to a question that I received about the USD Index recently.
Hi, I have been reading your articles about the USD bottoming and moving in a similar pattern to 2018. I am seeing a possible head and shoulder pattern on Jan 18th (left shoulder), Feb 5th (the head), and Feb 17th (right shoulder). For all its problems, the euro seems to be going higher and higher. Just wondering what your thoughts are.
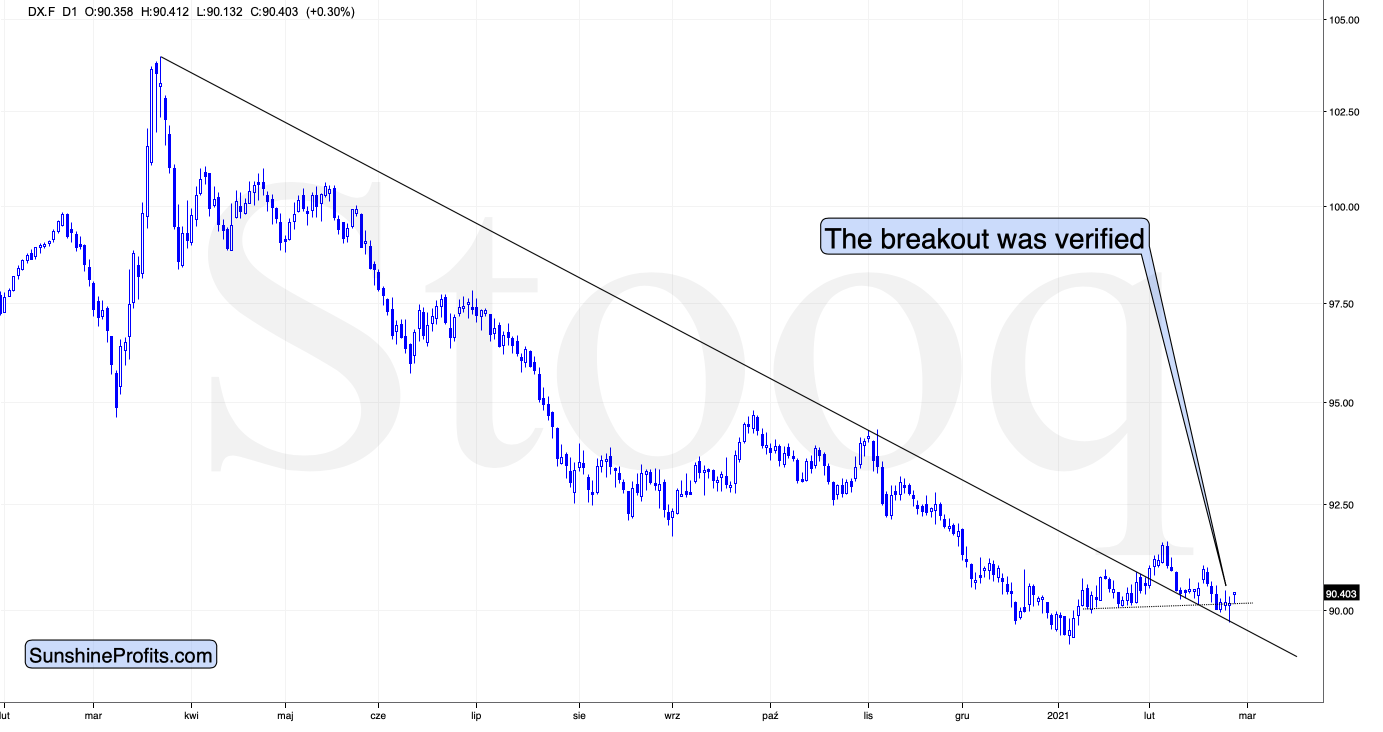
Figure 1
Indeed, the head-and-shoulders pattern formed as you described it (I added a dotted neckline to the formation on the above chart), but since it wasn’t as significant as the breakout above the declining medium-term resistance line, the implications of the latter overwhelmed the bearish implications of the H&S formation. The USD index invalidated the breakdown below the neck level of the formation, so what was previously a sell signal, has now turned into a buy signal. Consequently, we have yet another reason to expect higher values of the USD Index in the following weeks and months.
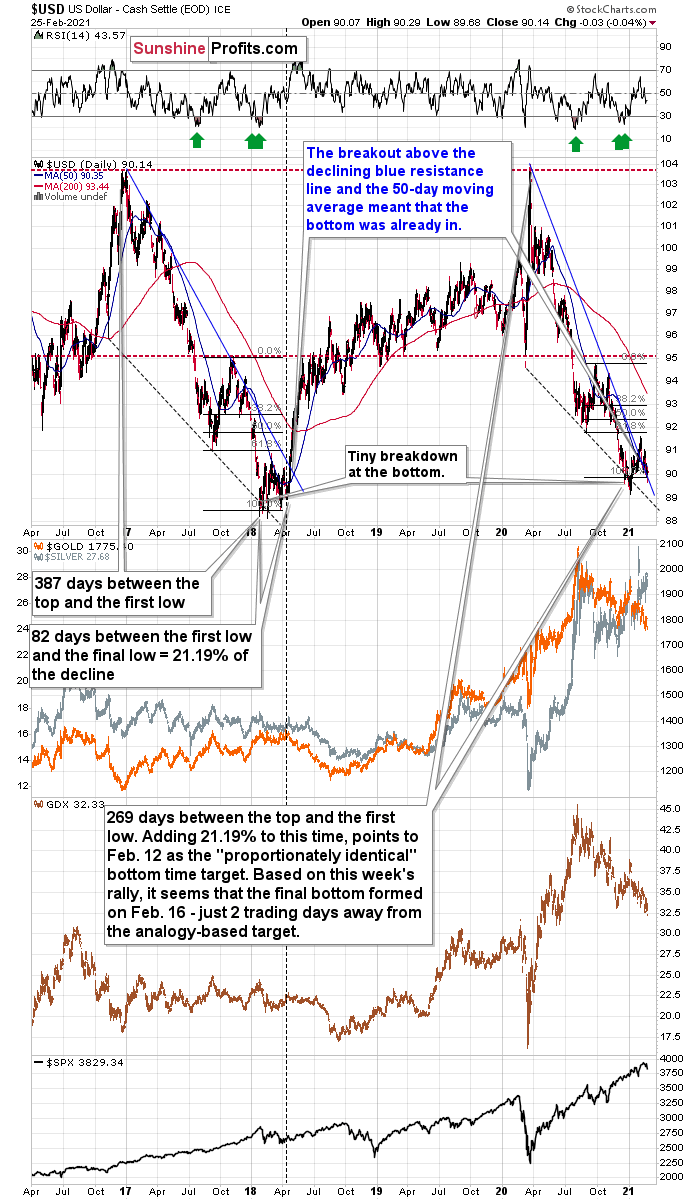
Figure 2
Based on the obvious similarity to early 2018, the verification of the breakdown is likely the final step before a major rally in the USDX. This will likely translate into lower precious metals and mining stock prices, especially if the general stock market declines as well.
Let’s use another question that I received to segue to the following part of the analysis.
What happens to gold if the dollar crashes, instead of going up?
That’s just what happened early during the day, yesterday (Feb. 25). Well, it was just intraday action rather than a big medium-term crash, however, it shows what could happen. Simply put, gold declined anyway. Why did it do so? Because it wanted to do so based on technical/emotional factors. Maybe that was just a temporary reversion in direction? No – when the USD Index came back up, gold declined even more, and we see the continuation of this pattern today as well.
What if the USD Index declines much more? The last time when gold was trading at these levels in 2020, the USD Index was trading at about 100. The latter declined about 10 index points and gold is at the same level. So, gold has already proven its ability to ignore the USD’s declines. There will be a time when gold soars in response to even mild declines in the USDX, but this is likely to happen only after gold declines significantly – and it “wants” to rally.
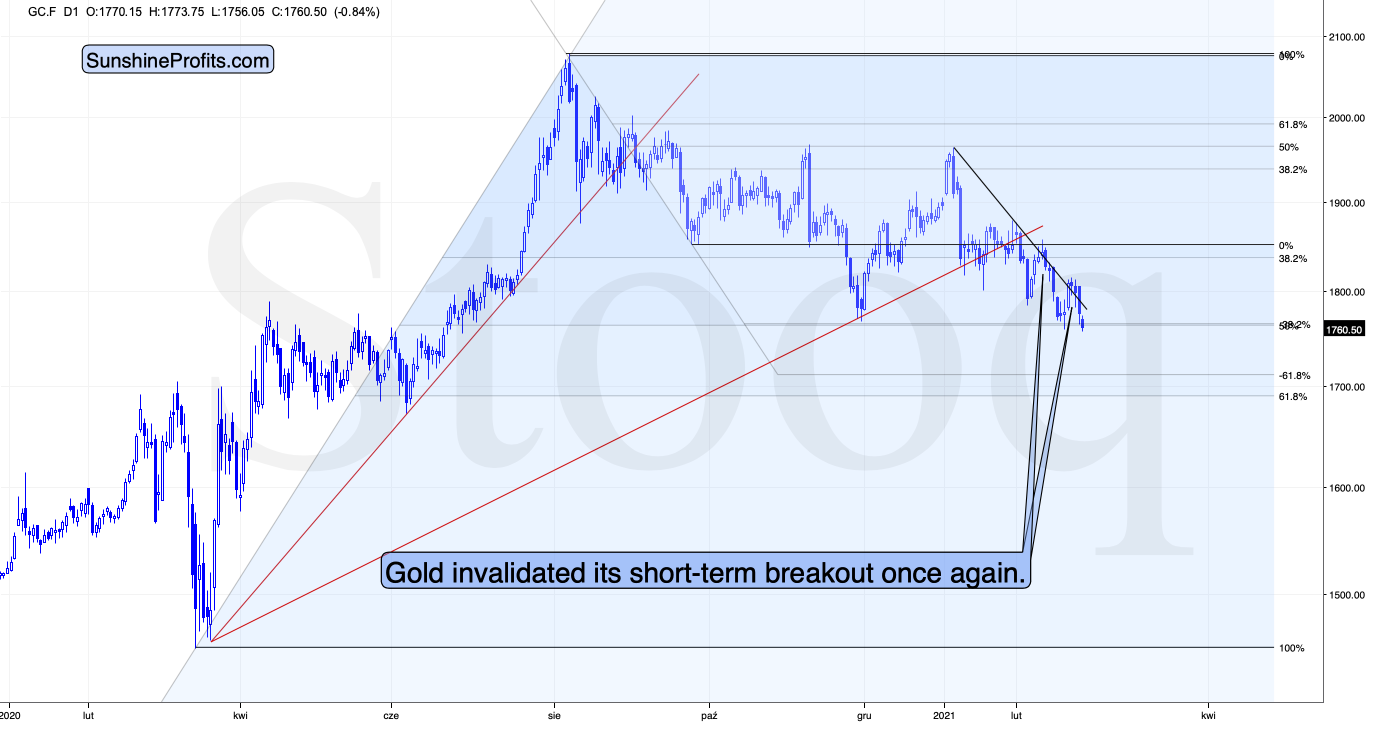
Figure 3
In previous analyses, I commented on the above chart in the following way:
The move higher in gold was notable, but nothing game changing. The last time gold moved above the declining short-term resistance line, was when it actually topped. The invalidation of the breakdown marked the start of another very short-term decline. The small decline in today’s overnight trading might be the very beginning of this invalidation that leads to another slide.
That’s exactly what happened. The failed breakout led to another slide and gold is currently right after its breakdown to new 2021 lows. The road to ~$1,700 gold is now fully open. That’s when gold would be likely to take some sort of breather and gather strength (well, weakness, but “gathering weakness” just doesn’t sound right) for another wave down – likely to $1,500 or so.
Please note that gold didn’t close at new yearly lows yesterday. This observation is important in comparison with the fact that…
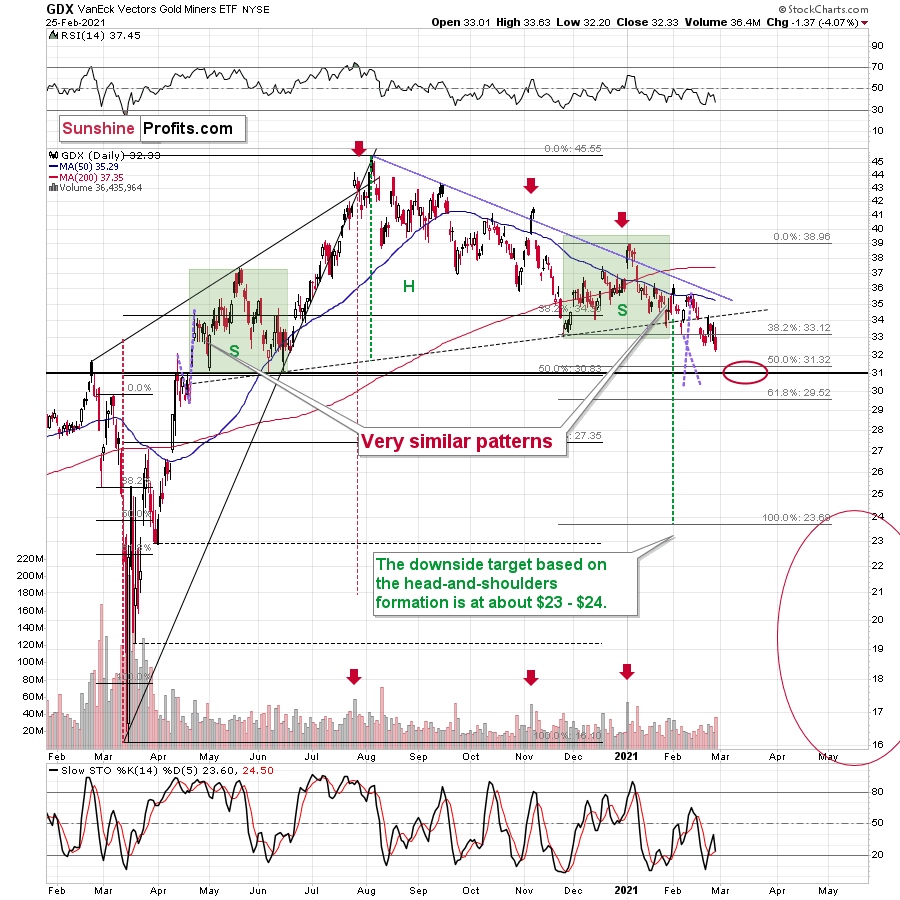
Figure 4
Mining stocks did.
Miners closed at new 2021 lows yesterday, even though gold didn’t, which once again proves their weakness and once again confirms the bearish outlook.
I previously wrote that gold’s ~$1,700 target is likely to be aligned with the GDX’s ~$31 target and this remains up-to-date. After that, I expect some kind of corrective upswing – perhaps to $33 or so, and then another – big – move lower. Please note that the corrective upswing would be yet another (and final) verification of the head and shoulders pattern, and its very bearish implications would take place only after this verification. That’s why I expect the decline to be particularly significant. You can read more about this broad H&S pattern over here.
Silver just went through a triangle-vertex-based reversal, and it seems to have indeed triggered a reversal.
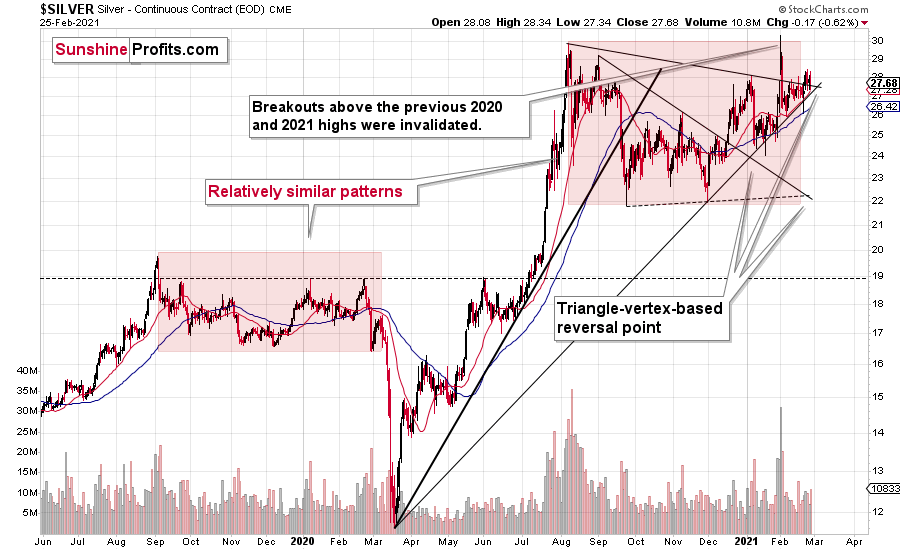
Figure 5
Silver moved a bit higher on Wednesday (Feb. 24) and in yesterday’s early trading, but it didn’t exceed the recent high. This means that my previous comments on the above chart remain up-to-date:
The move lower is not yet super significant, but given the reversal point, it could just be the beginning. Remember the triangle-vertex-based reversal at the beginning of the year? Back then, practically nobody wanted to believe that silver and the precious metals market was topping at that time. It was the truth, though. Gold and mining stocks were never higher since that time and the same thing would have most likely happened to silver if it wasn’t the #silversqueeze popularity that gave it its most recent boost.
Now, there’s also another triangle-vertex-based-reversal in a few days, and since these reversals tend to work on a near-to basis, silver might top any day now, even if it hasn’t topped earlier today.
Based on what’s happening in the markets right now, it seems just as possible that silver and the rest of the precious metals market will form a temporary bottom within the next few days.
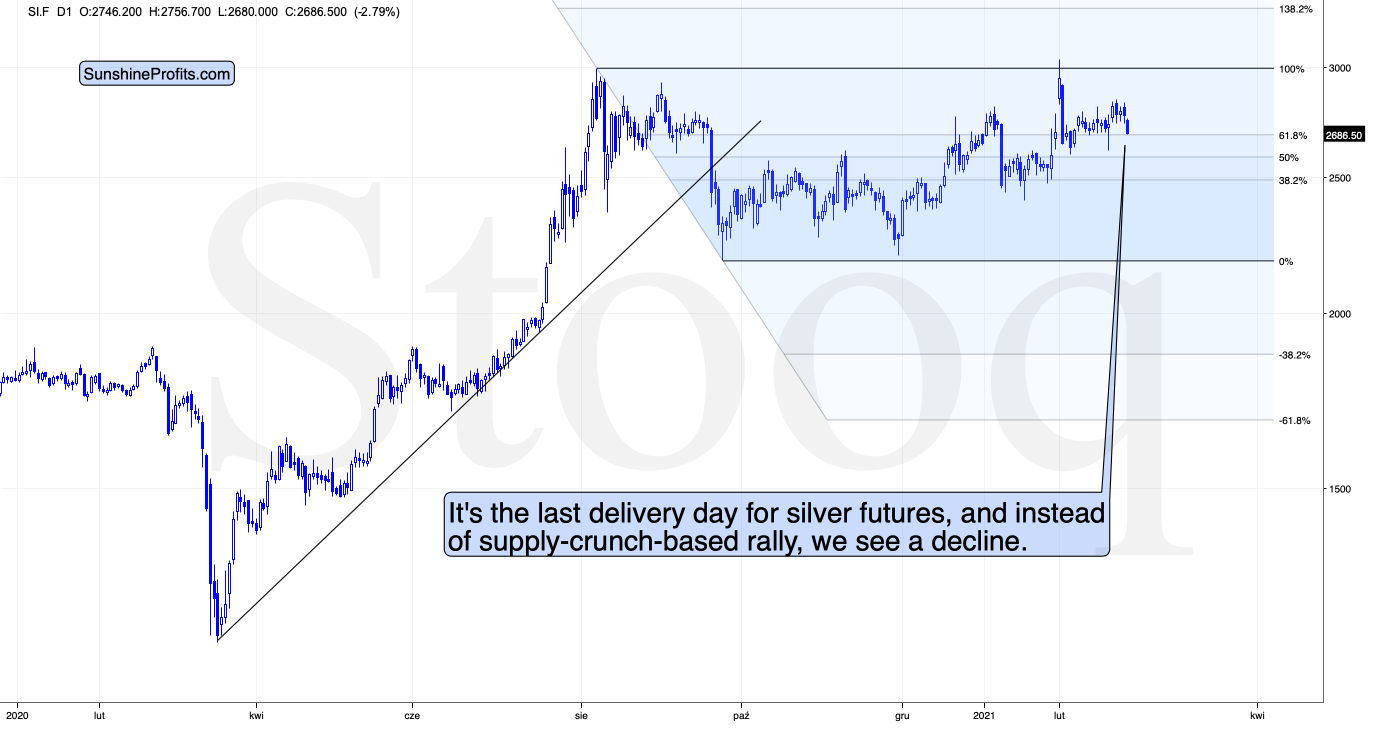
Figure 6
Moreover, please note that it’s the last delivery day for silver futures, and instead of a supply-crunch-based rally, we see a decline. Naturally, this is bearish.
Disclaimer: All essays, research, and information found on the Website represent the analyses and opinions of Mr. Radomski and Sunshine Profits' associates only. As such, it may prove wrong ...
more


Thank you again for the excellent analyses throughout the week, Mr. Radomski. I continue to find your precious metal insight really informative and reliable, both on short and long-term, especially on the short-term bearishness.