DeFi Is Rising Within A Bullish Impulse
The underlying asset of the DEFI Composite Index perpetual contract consists of a basket of decentralized finance (DeFi) protocol tokens listed on Binance. The index price is calculated using weighted averages of real time prices of the tokens on Binance. The DEFI Composite Index is denominated in USDT.
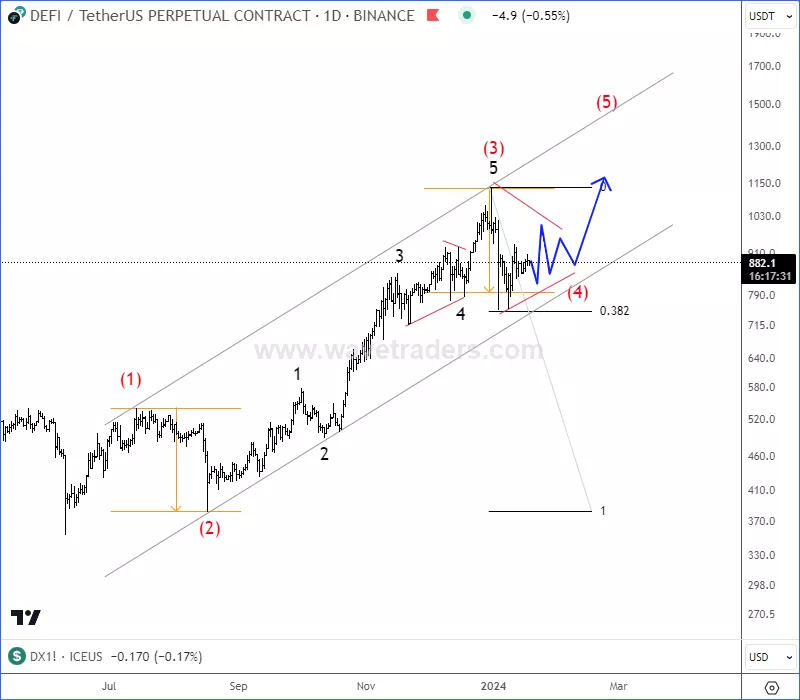
If we take a look at DeFi Index chart, we can see an impressive recovery in the second part of 2023, which seems to be an impulsive five-wave rally that can send the price higher in 2024.
(Click on image to enlarge)

Currently we can see some slow down, but it looks like a clear wave (4) correction that can send the price higher for wave (5). However, while Crypto total market cap chart is looking for a deeper corrective decline, DeFi may just stay sideways within a potential bullish triangle pattern in wave (4) before we will see a breakout higher for wave (5).
(Click on image to enlarge)

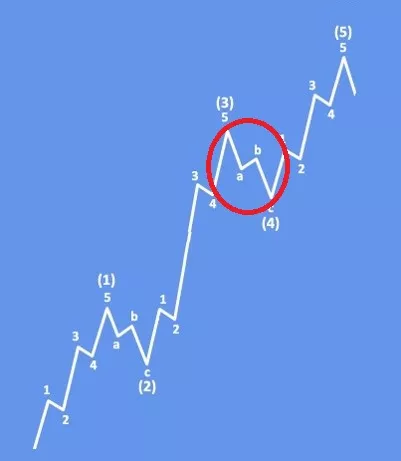
Basic Impulsive Bullish Pattern shows that DeFi can be trading in wave 4 correction before a continuation higher for wave (5). Wave (4) can be any type of a corrective pattern, but we think it can be a triangle.
More By This Author:
Corn Is Trading At Support While Finishing Correction
Nasdaq 100 May Face A Higher Degree Correction Soon
Bitcoin May Slow Down Within A Higher Degree Correction Soon
For more analysis visit us at www.wavetraders.com and make sure to follow us on Twitter (https://twitter.com/GregaHorvatFX)


