
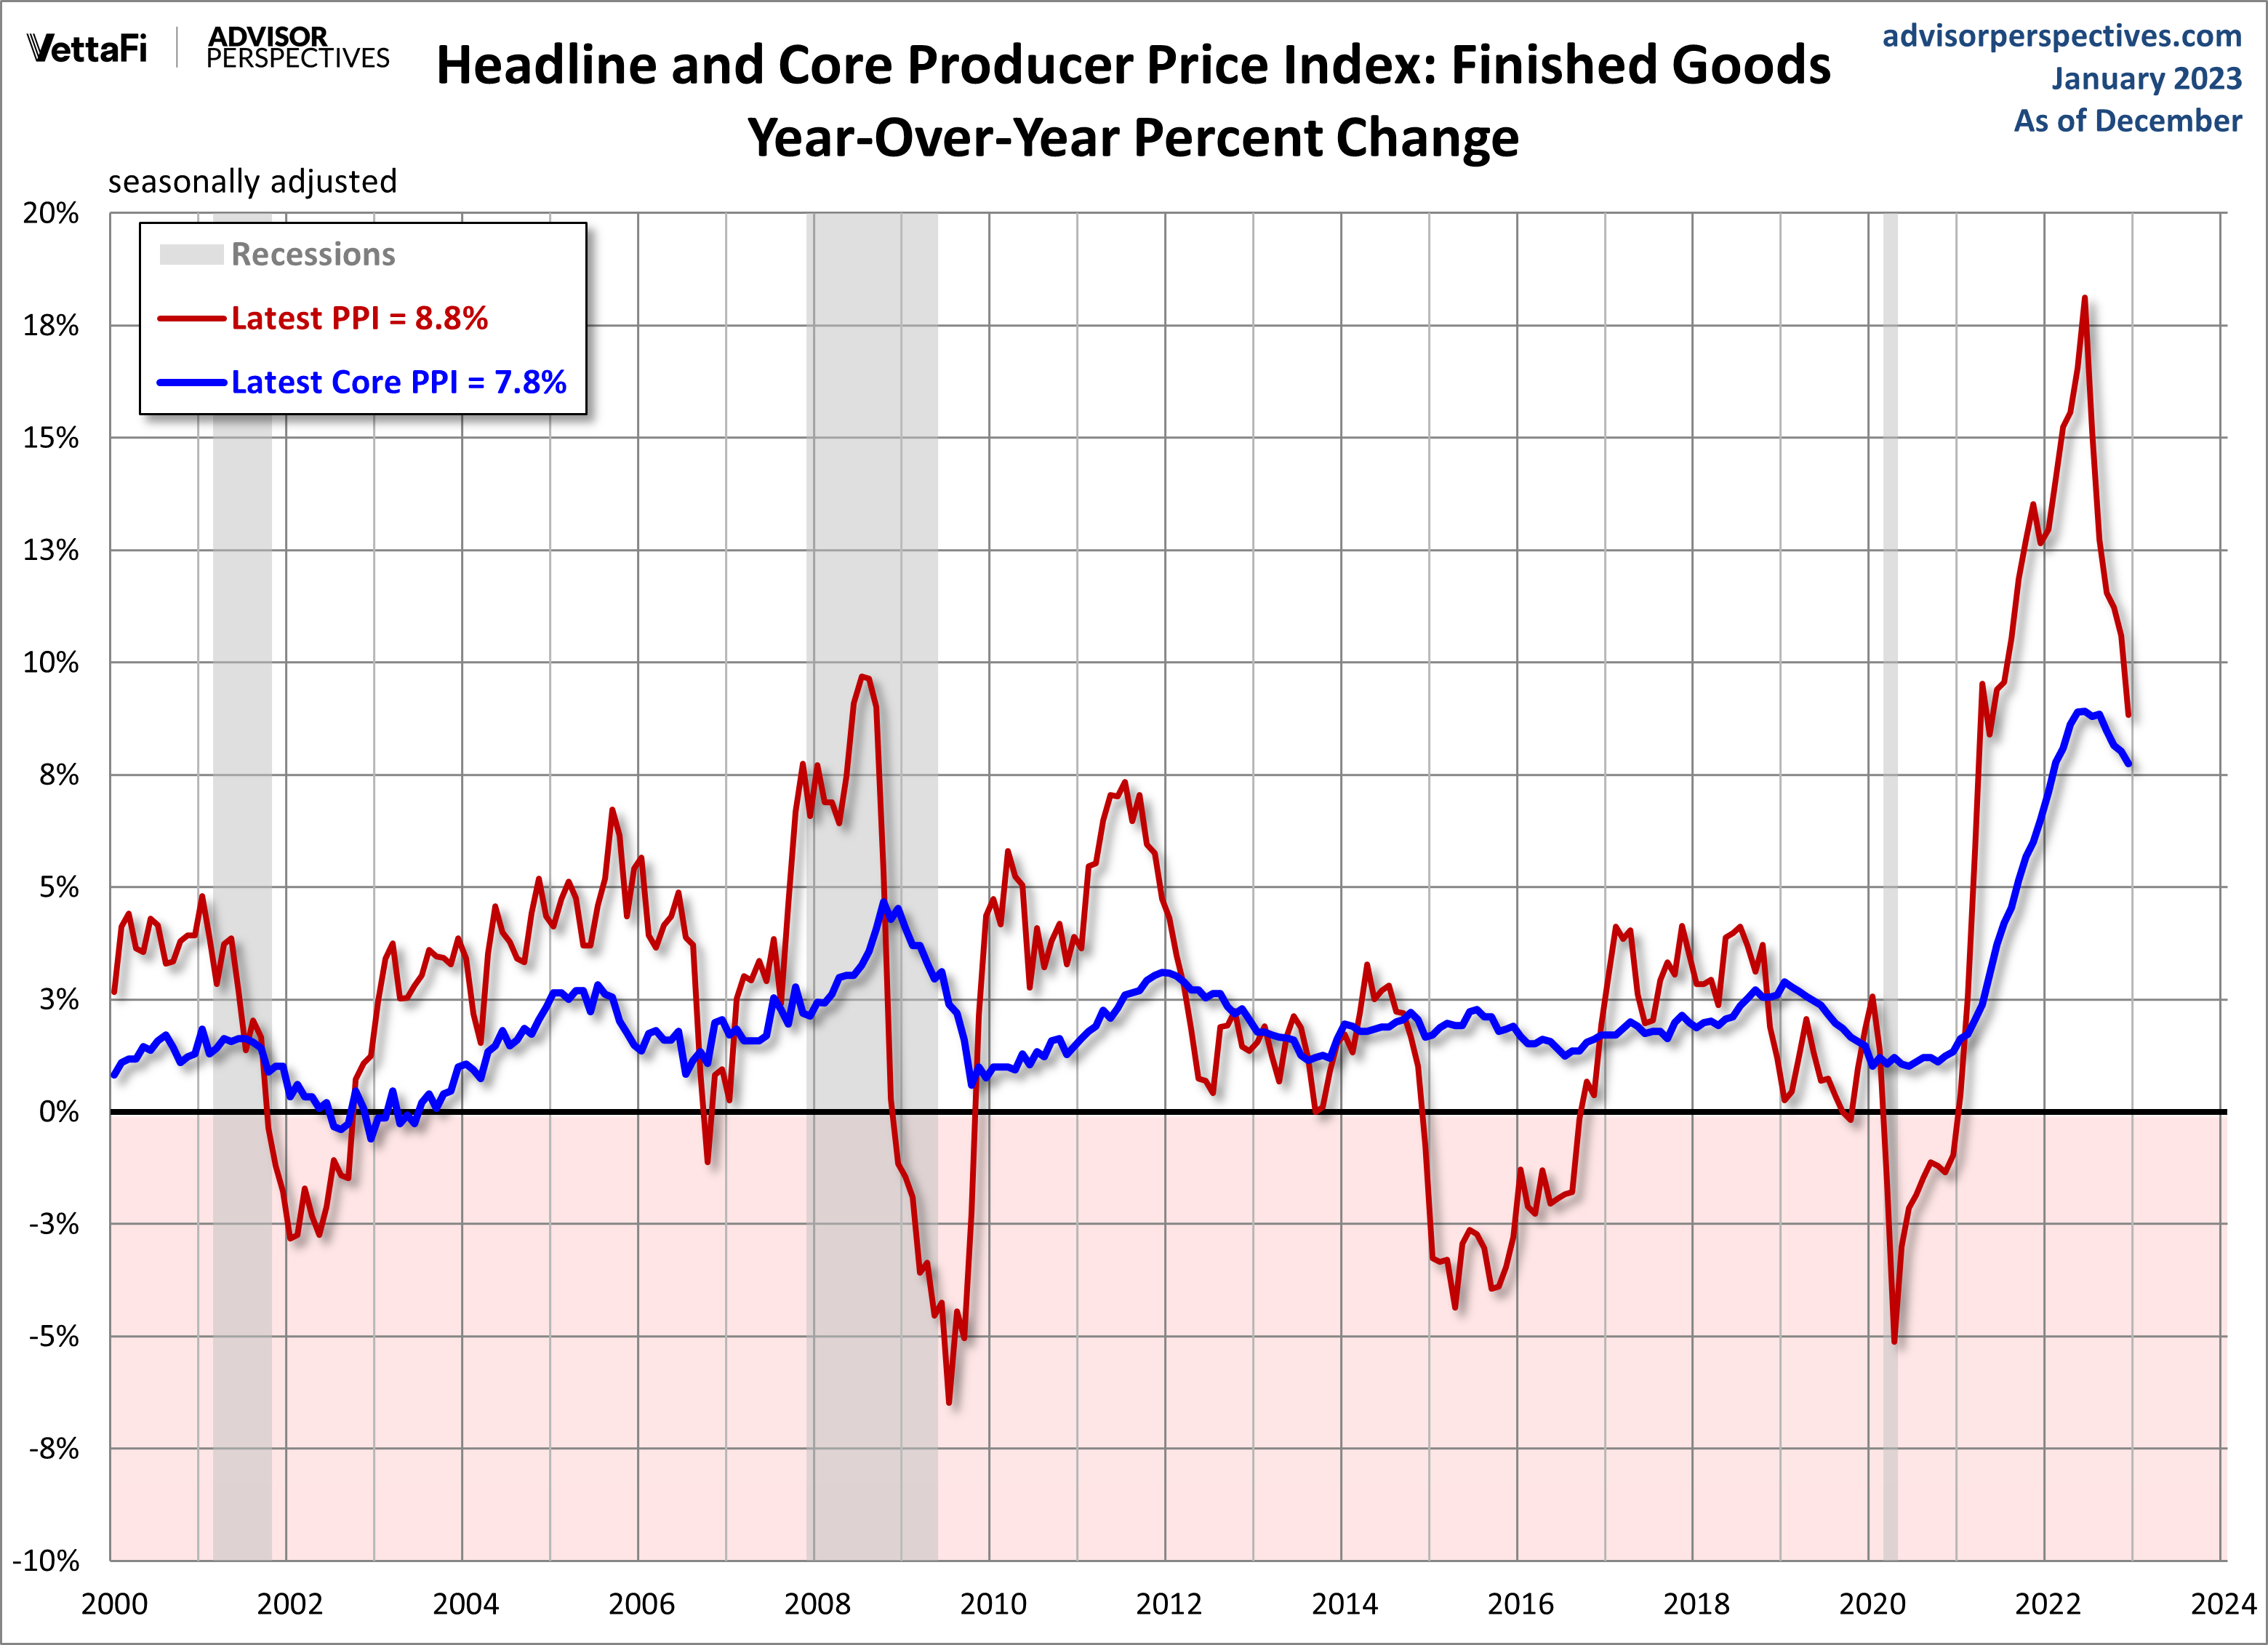
This morning's release of the December Producer Price Index (PPI) for Finished Goods was down 1.5% month-over-month seasonally adjusted, down from a 0.2% increase last month. It is at 8.8% year-over-year, down from a 10.6% increase last month, on a seasonally adjusted basis.
The December PPI for Final Demand was at -0.5% month-over-month seasonally adjusted, down from last month's 0.2% increase. Investing.com MoM consensus forecasts for Final Demand headline was -0.1%.
Here is the summary of the news release on Final Demand:
The Producer Price Index for final demand declined 0.5 percent in December, seasonally adjusted, the U.S. Bureau of Labor Statistics reported today. Final demand prices advanced 0.2 percent in November and 0.4 percent in October. (See table A.) On an unadjusted basis, the index for final demand increased 6.2 percent in 2022 after rising 10.0 percent in 2021.
In December, the decrease in the final demand index can be attributed to a 1.6-percent decline in prices for final demand goods. In contrast, the index for final demand services rose 0.1 percent.
Prices for final demand less foods, energy, and trade services edged up 0.1 percent in December after increasing 0.3 percent in November. The index for final demand less foods, energy, and trade services advanced 4.6 percent in 2022 following a 7.0-percent rise in 2021. [More...]
Finished Goods: Headline and Core
The BLS shifted its focus to its new "Final Demand" series in 2014, a shift we support. However, the data for these series are only constructed back to November 2009 for Headline and April 2010 for Core. Since our focus is on longer-term trends, we continue to track the legacy Producer Price Index for Finished Goods, which the BLS also includes in their monthly updates.
As this (older) overlay illustrates, the Final Demand and Finished Goods indexes are highly correlated.
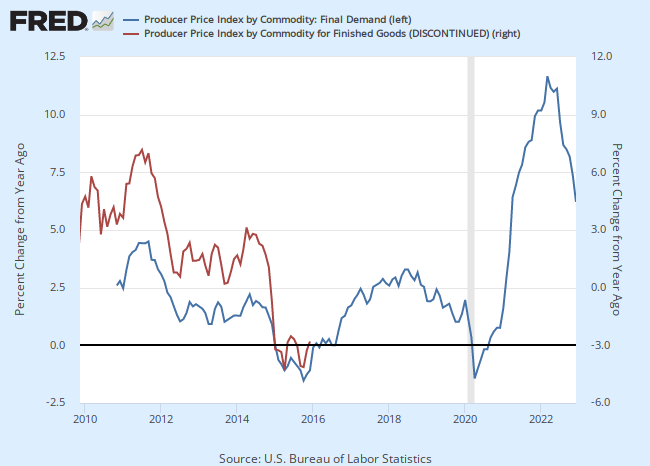
FRED® Graphs ©Federal Reserve Bank of St. Louis. All rights reserved.
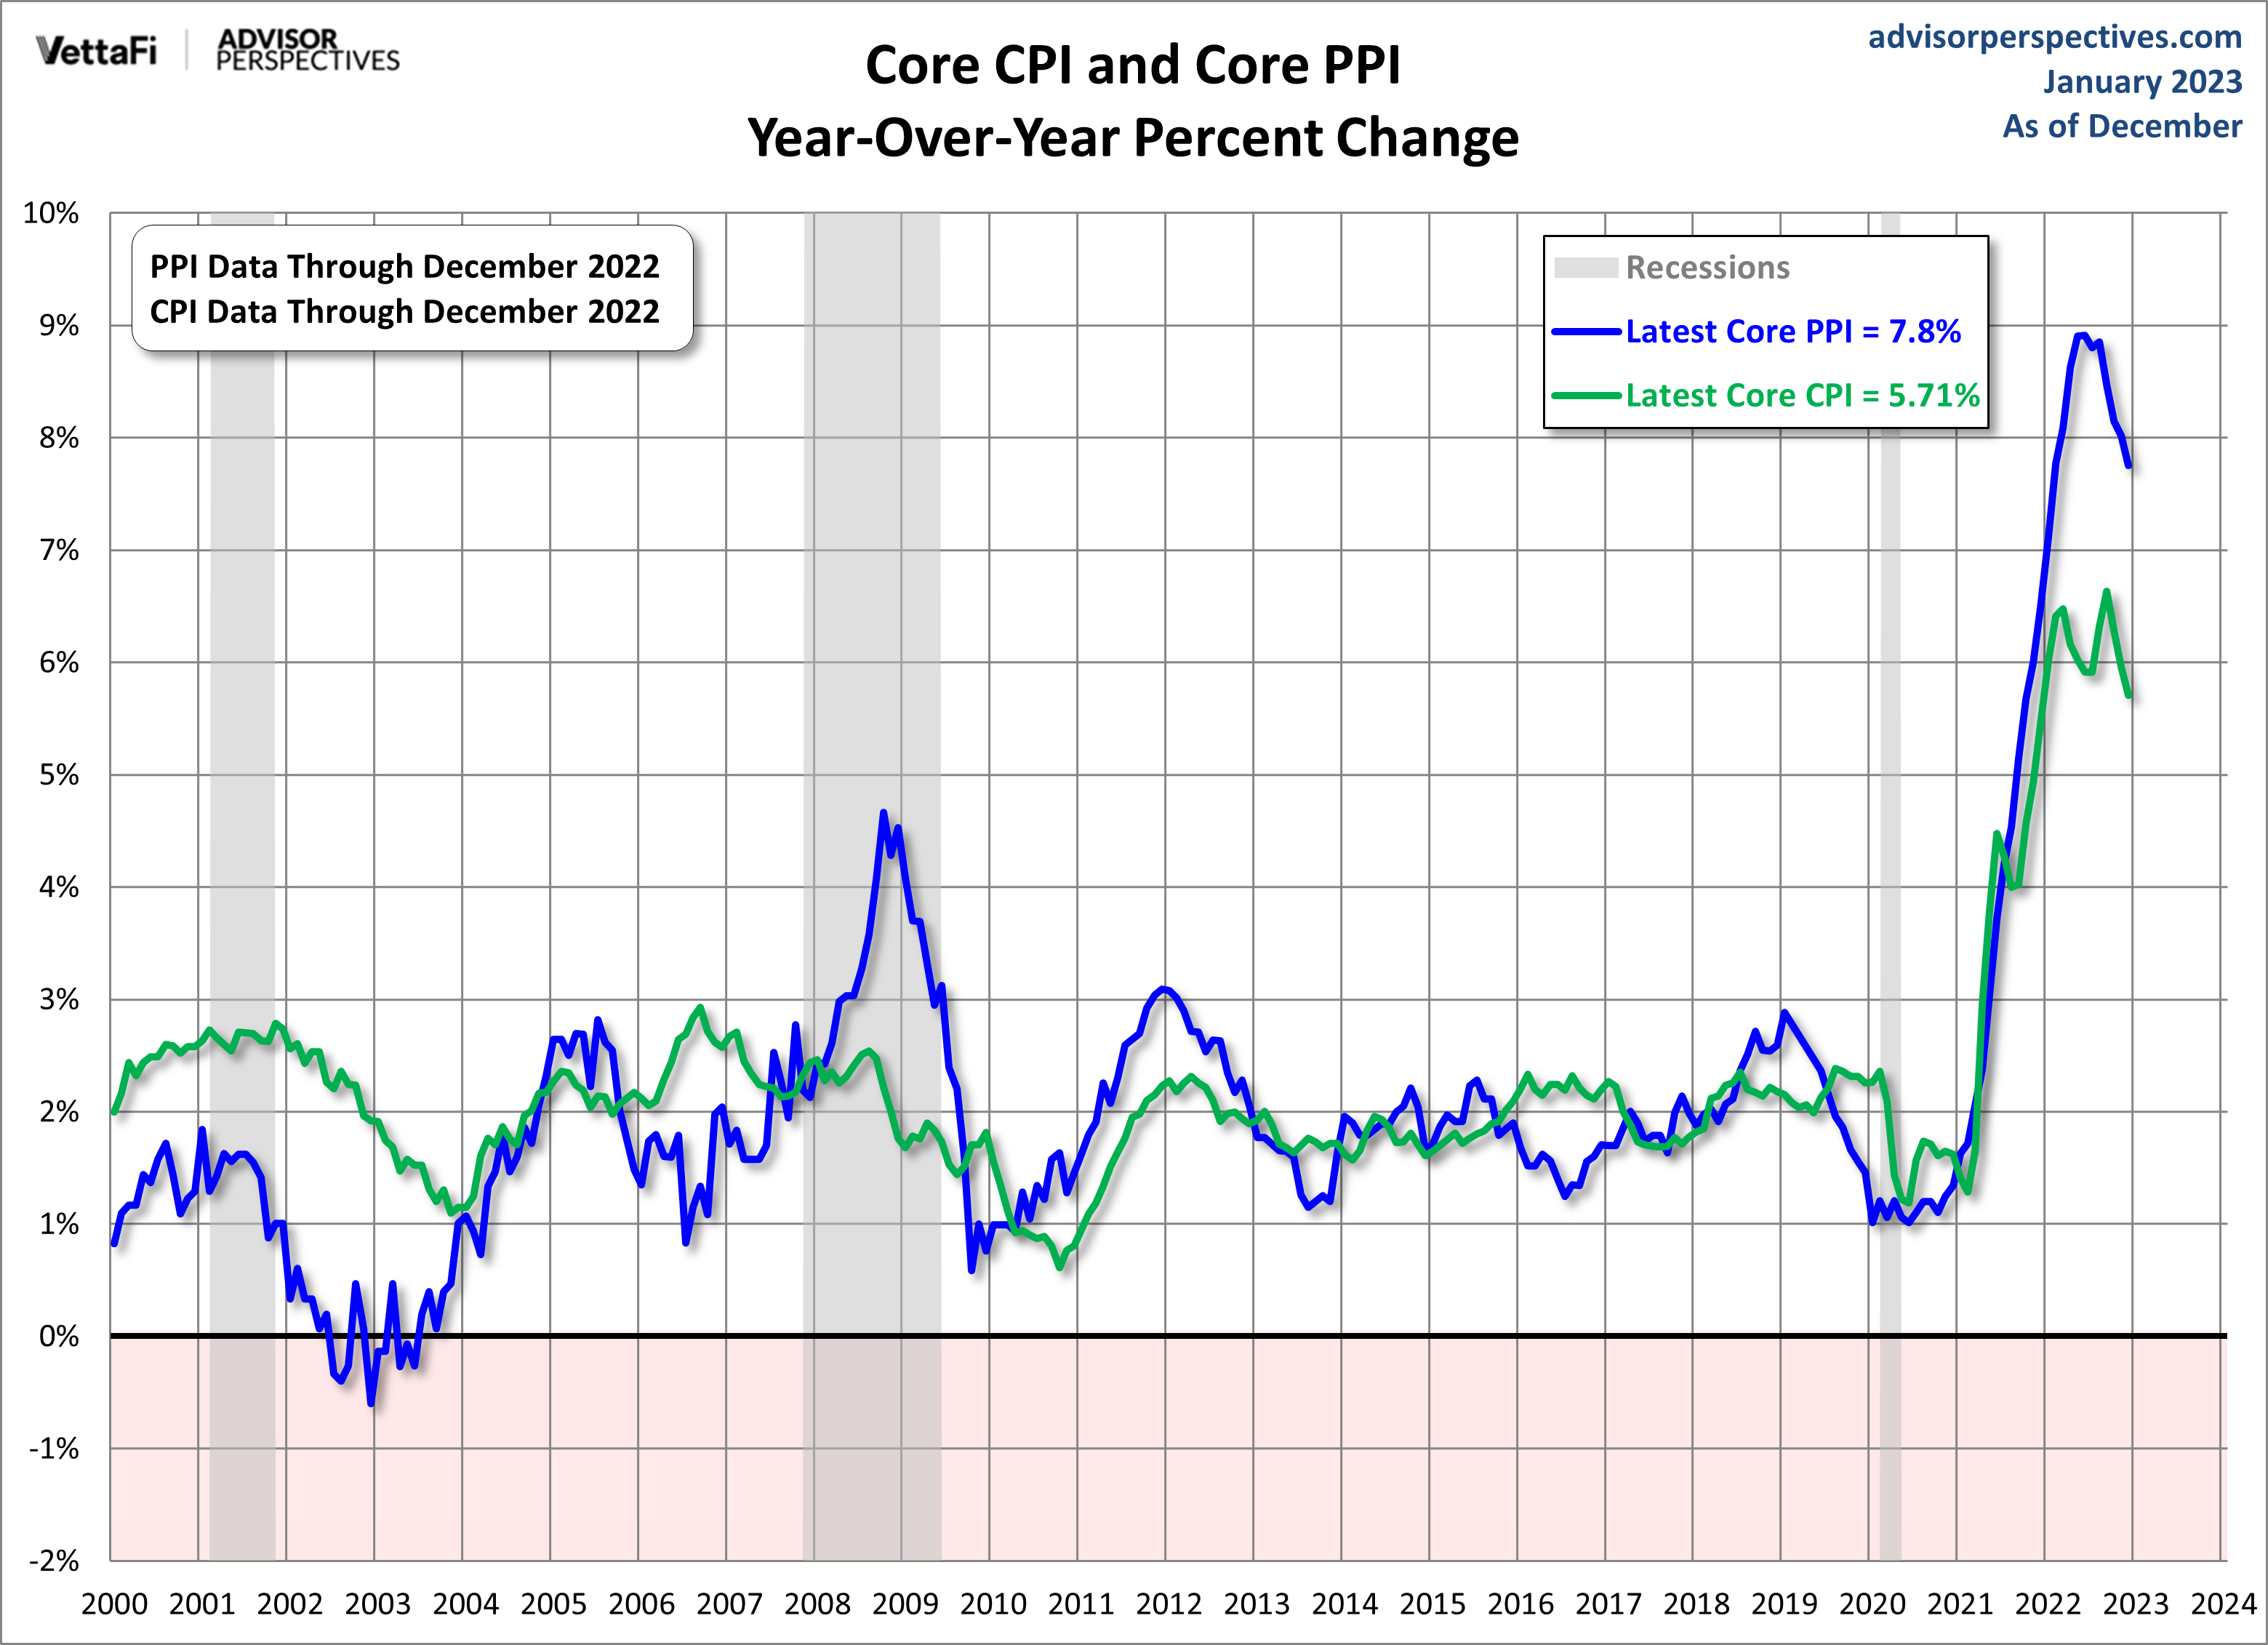
As the next chart shows, the Core Producer Price Index is far more volatile than the Core Consumer Price Index. For example, during the last recession producers were unable to pass cost increases to the consumer.
More By This Author:
World Markets Update - Tuesday, Jan. 17
Long-Term Look At The CPI
Empire State Manufacturing Survey: Activity Contracted Sharply In January


Comments
Log in or sign up to join the conversation.