Dallas Fed Manufacturing Outlook: "Expansion Continues"
This morning the Dallas Fed released its Texas Manufacturing Outlook Survey (TMOS) for October. The latest general business activity index came in at -5.1, down 6.6 from 1.5 in September. All figures are seasonally adjusted.
Here is an excerpt from the latest report:
Texas factory activity continued to expand in October, albeit at a markedly slower pace, according to business executives responding to the Texas Manufacturing Outlook Survey. The production index, a key measure of state manufacturing conditions, fell nine points to 4.5, suggesting a moderation in output growth in October.
Perceptions of broader business conditions were mixed in October. The general business activity index fell from 1.5 to -5.1, returning to negative territory after two months of positive readings. The company outlook index continued to increase, inching up to 8.8 this month. The index measuring uncertainty regarding companies’ outlooks remained slightly elevated at 12.1.
Expectations regarding future business conditions were more optimistic in October. The index of future general business activity returned to positive territory, rising nine points to 2.4. The index of future company outlook rose 13 points to 15.3, its highest level in six months. Other indexes for future manufacturing activity also rose, pushing further into positive territory.
Monthly data for this indicator only dates back to 2004, so it is difficult to see the full potential of this indicator without several business cycles of data. Nevertheless, it is an interesting and important regional manufacturing indicator. The Dallas Fed on the TMOS importance:
Texas is important to the nation’s manufacturing output. The state produced $159 billion in manufactured goods in 2008, roughly 9.5 percent of the country’s manufacturing output. Texas ranks second behind California in factory production and first as an exporter of manufactured goods.
Texas turns out a large share of the country’s production of petroleum and coal products, reflecting the significance of the region’s refining industry. Texas also produces over 10 percent of the nation’s computer and electronics products and nonmetallic mineral products, such as brick, glass and cement.
Here is a snapshot of the complete TMOS.
(Click on image to enlarge)

The next chart is an overlay of the General Business Activity Index and the Future Outlook Index — the outlook six months ahead.
(Click on image to enlarge)

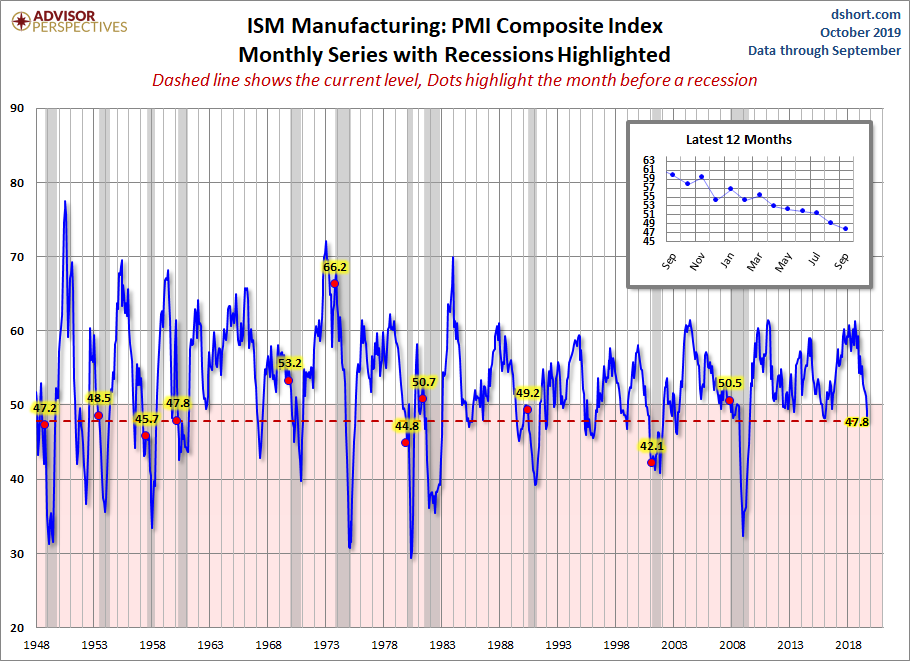
For comparison, here is the latest ISM Manufacturing survey.
(Click on image to enlarge)
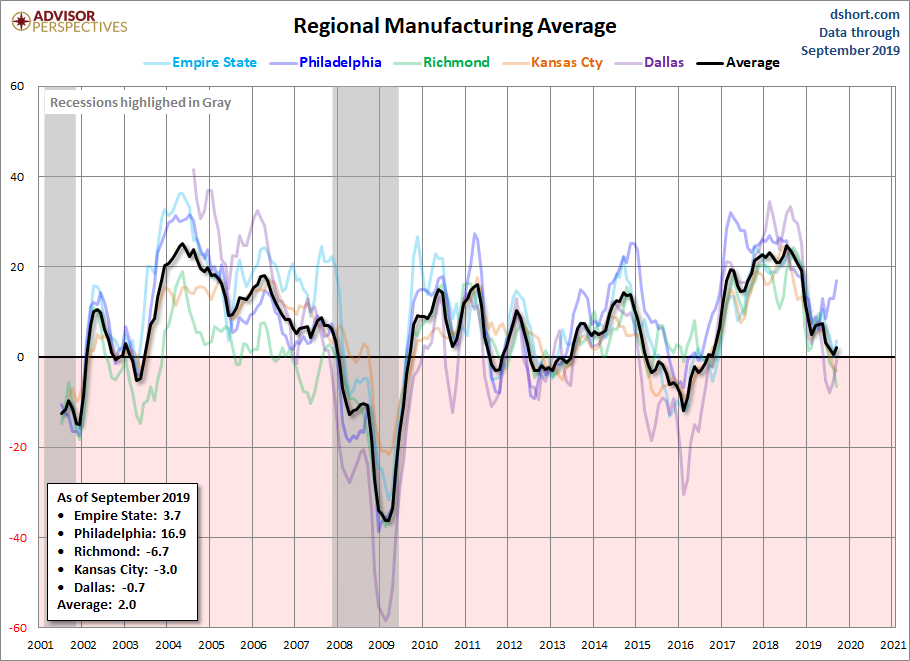
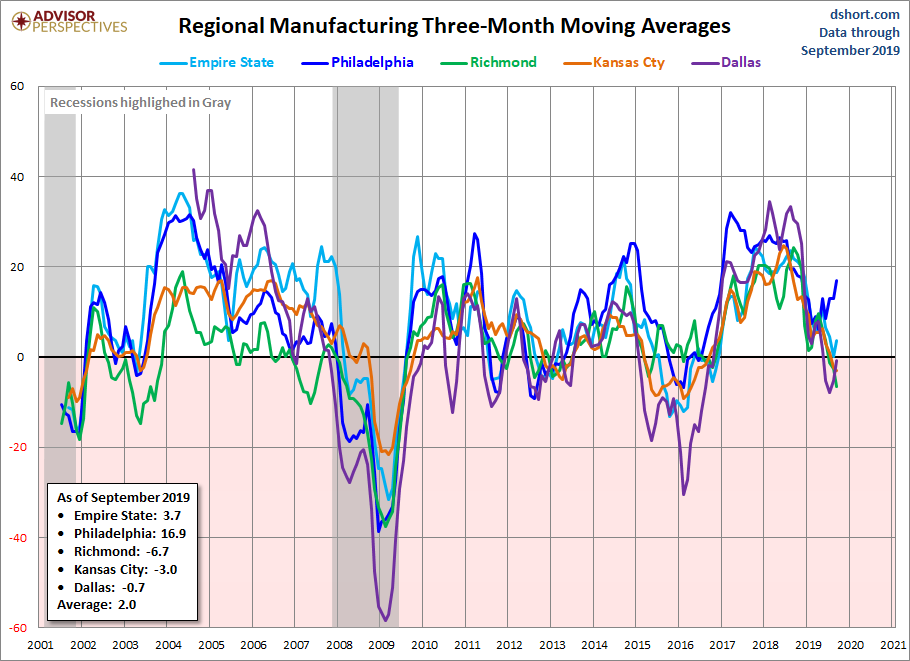
Let's compare all five Regional Manufacturing indicators. Here is a three-month moving average overlay of each since 2001 (for those with data).
(Click on image to enlarge)
Here is the same chart including the average of the five for the latest month with complete data.
(Click on image to enlarge)