
ZAR Price Outlook: USD/ZAR Slides Lower, PMI Data And USD Sentiment Shift
FLURRY OF PMI DATA TO START THE TRADING WEEK
Yesterday, the ZAR started the week, and the month, on the front foot as it strengthened against the US dollar. The corresponding drop in USD/ZAR appears after a period of rand depreciation against the greenback ever since the June low around R13.41.
US PMI data was generally positive despite the ISM Manufacturing PMI printing below the estimated figure (59.5 vs 60.9). Readings above 50 indicate that purchasing managers are optimistic about an economic expansion, while figures below 50 indicate economic pessimism.
Absa PMI from yesterday indicated a decline in local economic sentiment coming in at 43.55 from a previous 57.40, the first reading below 50 since July last year. Tomorrow’s Standard Bank PMI data should help to provide confirmation of the current outlook if the numbers tell a similar story.
Other key economic releases this week include US initial jobless claims, non-farm payrolls, and the US unemployment rate.
DailyFX Economic Calendar Highlighting Major Risk Events Ahead
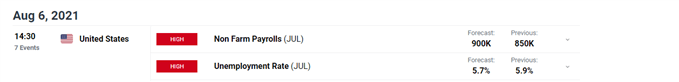
For all market-moving data releases and events see the DailyFX Economic Calendar
USD/ZAR - KEY TECHNICAL LEVELS
After failing to break above the 15.00 psychological level, USD/ZAR turned sharply lower, making a series of lower candles with extended upper wicks – usually representing a rejection of higher prices.
However, there was little indication of yesterday’s drastic move lower as the prior two trading days both closed in the green, respecting the 14.50 level and the intermediate-term trendline support.
The breakdown of the ascending trendline has been validated by further selling in the morning session and a move back towards 14.14 has become more realistic.
USD/ZAR Daily Chart
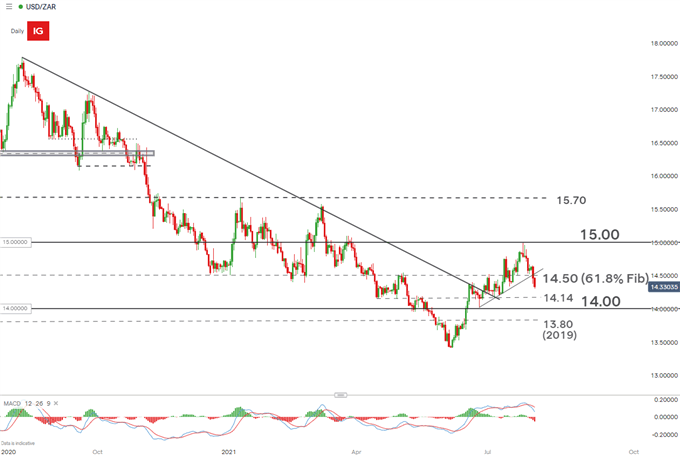
Chart prepared by Richard Snow, IG
The 4-hour chart, highlights the recent USD/ZAR trading range and the clean breakdown of this range. The break is somewhat significant as significant momentum would be needed to break below the ascending trendline and the 14.50 psychological level; which happens to coincide with the 61.8% Fibonacci level (drawn form the Feb 2018 low to March 2020 high).
The newfound momentum continues and has already traded below the initial level of support at 14.3350. In addition, the pair remains vulnerable to a move towards 14.14.
USD/ZAR bulls will be looking to close the day above the 14.3350 level if there is any chance of a move higher, toward that psychologically important 14.50 level.
USD Sentiment Shift
CFTC data from the most recent report revealed that sentiment in the greenback flipped net long – the first time since the pandemic shook the global economy in March 2020. Increased dollar buying may contribute towards potentially higher moves in USD/ZAR in the coming weeks. See the full article on the latest CFTC report for more insight and analysis.
UZD/ZAR 4-Hour Chart
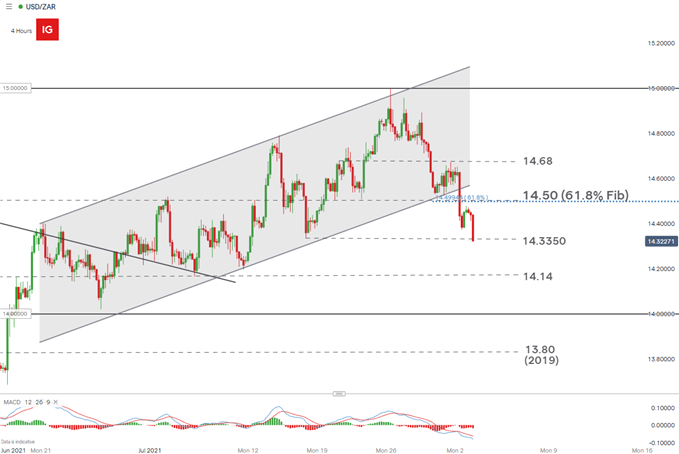
Chart prepared by Richard Snow, IG
Disclaimer: DailyForex will not be held liable for any loss or damage resulting from reliance on the information contained within this website including market news, analysis, trading signals ...
more

