
Our weekly Elliott Wave analysis reviews the EUR/USD 4 hour chart, the Bitcoin crypto currency daily chart, and the USD/JPY 4 hour chart.
EUR/USD Bullish ABC Zigzag Pattern
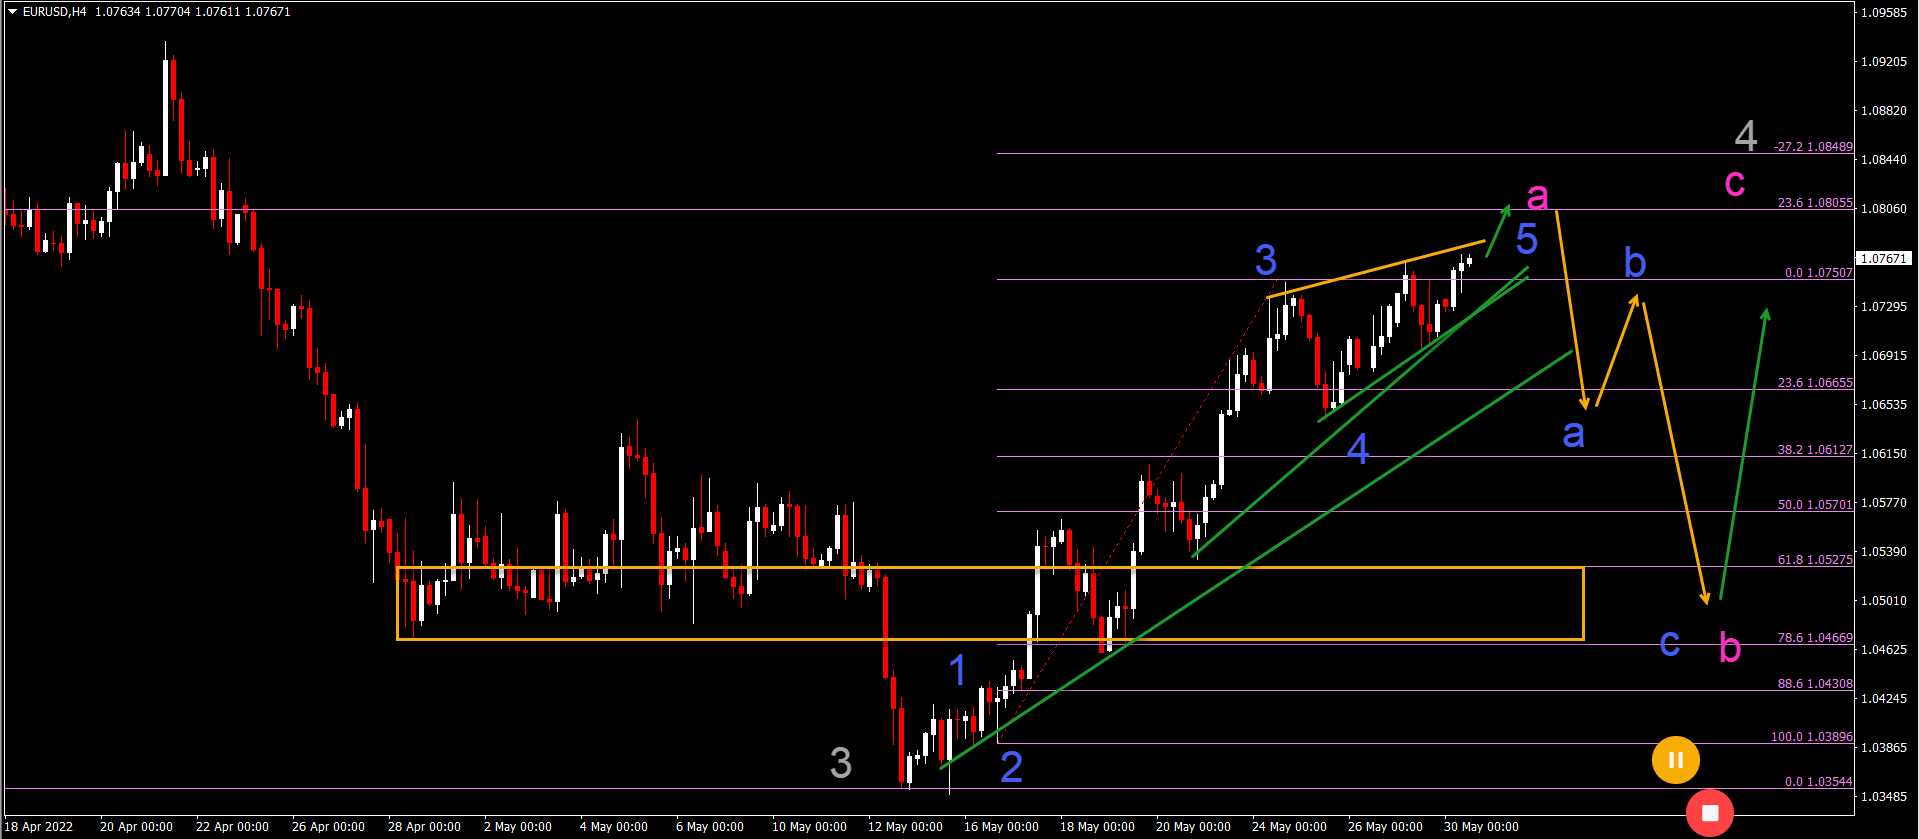
The EUR/USD completed a wave 3 (gray) of a larger downtrend. Now price action is preparing for a larger bullish correction:
- The EUR/USD bullish price swing is unfolding in a 5 wave pattern (blue).
- The current wave is probably a wave 5 (blue) of a larger wave A (pink).
- The first target is the larger 23.6% Fibonacci retracement level of the wave 4 (gray).
- A bearish bounce (orange arrows) could take place at the resistance level.
- A bearish correction should create an ABC (blue) pattern in wave B (pink).
- The bearish swing should not break the bottom otherwise the ABC (pink) zigzag becomes invalidated.
- A bullish wave C (pink) could complete wave 4 (gray) or a wave W of 4.
(Click on image to enlarge)
USD/JPY
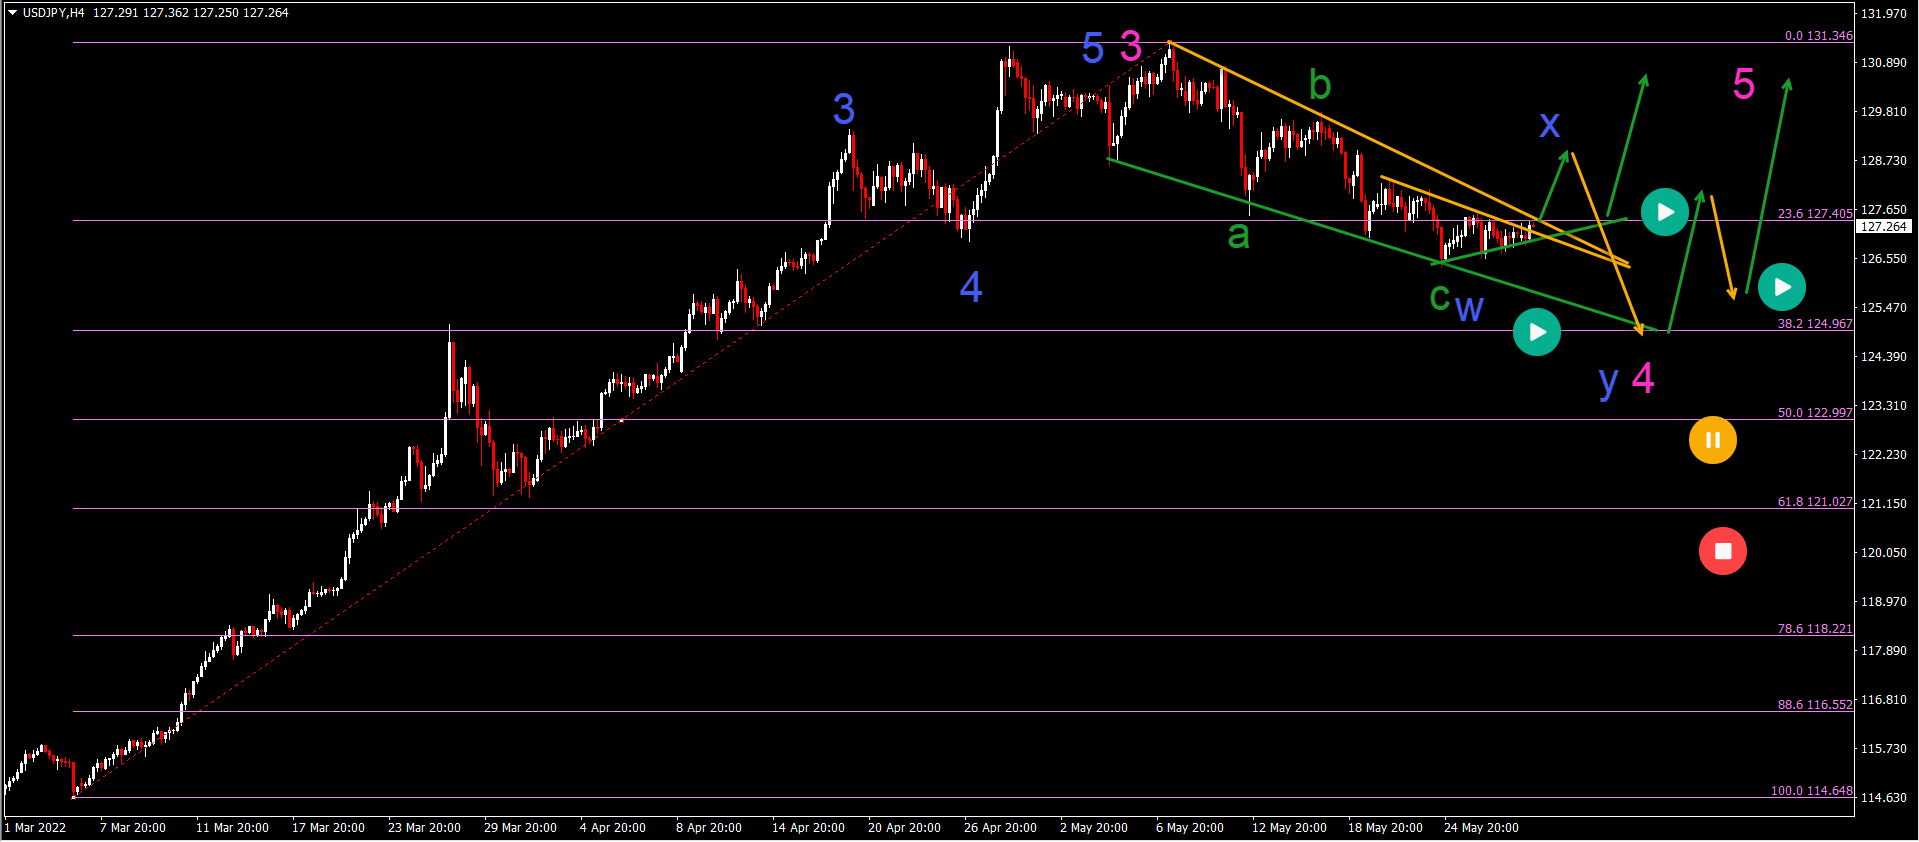
The USD/JPY is building a bearish correction in a solid uptrend:
- The uptrend seems to have completed a wave 3 (pink) pattern.
- The bearish correction is choppy and shallow, as usual for a wave 4 (pink).
- The wave 4 (pink) remains valid as long as price action does not correct below the 50% Fib or deeper.
- A complex correction via a WXY (blue) pattern could unfold in wave 4 (pink).
- A bullish bounce is expected at the 38.2% Fibonacci level if price action manages to reach it.
- Price action needs a clear higher low plus bounce before the wave 4 (pink) could be considered completed.
(Click on image to enlarge)
BTC/USD Finding Support and a Bullish Bounce
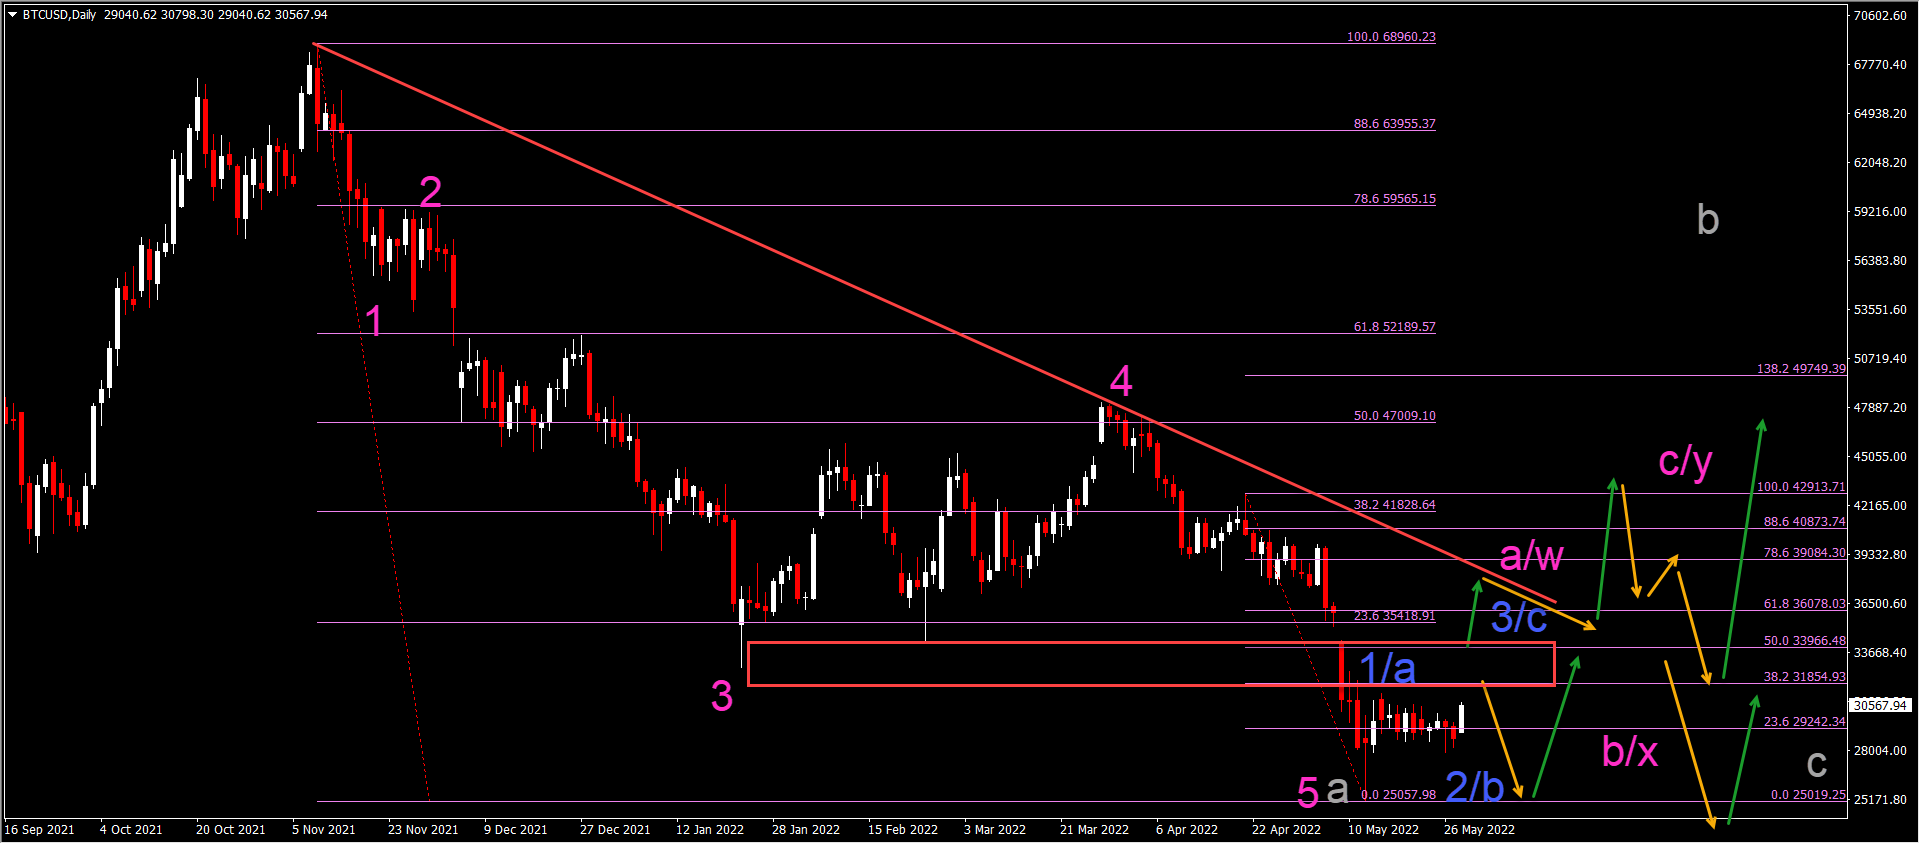
Bitcoin (BTC/USD) failed to break the support and lows for several days. Price action seems to be moving north now:
- The BTC/USD was in a strong downtrend.
- The main question is: has the downtrend completed a wave 5 (pink) of wave a (gray) or will there be one more low remaining?
- The resistance levels are the critical resistance zone for that decision.
- A bullish breakout (green arrow) could confirm a larger 123 (blue) pattern within an ABC (pink).
- A bearish bounce (orange arrow) could indicate an ABC (blue) pattern within a WXY (pink).
- Eventually price action is expected to complete an ABC (gray) pattern.
(Click on image to enlarge)


Comments
Log in or sign up to join the conversation.