Weekly Waves: EUR/USD, GBP/USD And Bitcoin - Monday, Oct. 31
Our weekly Elliott Wave analysis reviews the EUR/USD 4-hour chart, the GBP/USD 4-hour chart, and the Bitcoin daily chart.
EUR/USD Bearish ABC After Bullish Rally
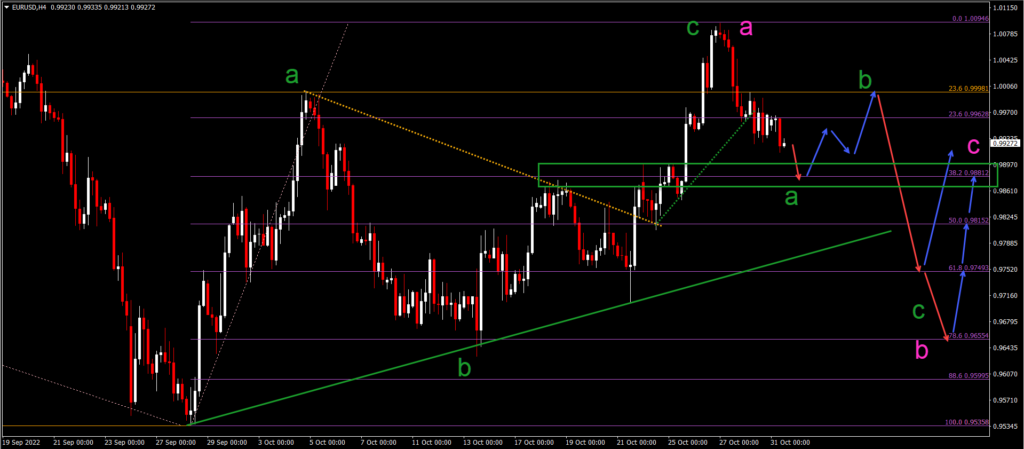
The EUR/USD made a bullish breakout rather than reaching the previous bottom last week as our analysis expected:
- The EUR/USD bullish breakout above the resistance trend line (dotted orange) sparked a bullish rally.
- This indicated the end of wave B (green) and the start of wave C (green).
- The bullish ABC (green) has probably completed wave A (pink) of a larger ABC correction (pink) in wave 4.
- Wave A (pink) seems completed and the current bearish price swing is expected to start wave A (green) within wave B (pink).
- The main target for wave A (green) is the 38.2% Fibonacci level.
- Later on, price action could drop lower to the deeper Fibonacci levels.
(Click on image to enlarge)
Bitcoin Breaks North of Key Resistance Trend Line
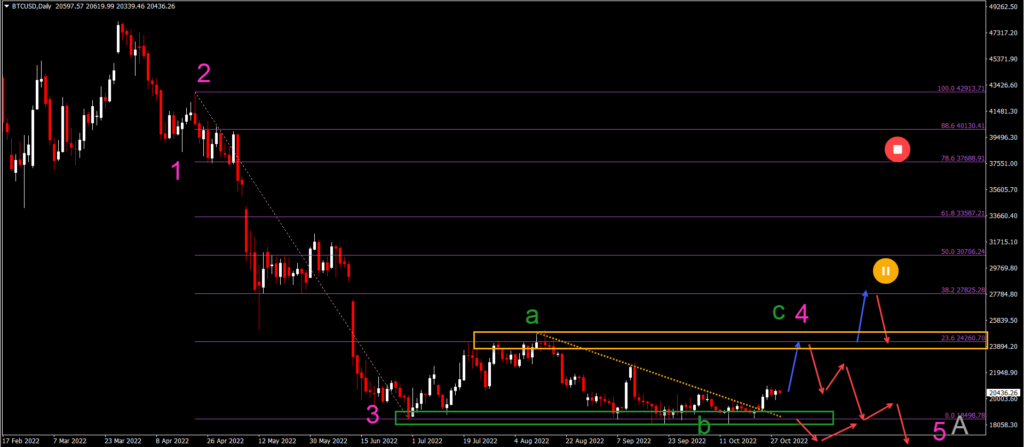
Bitcoin (BTC/USD) was unable to break below the previous bottoms and support zone (green box):
- BTC/USD made a bullish breakout above the resistance trend line (dotted orange).
- This breakout confirms the continuation of wave 4 (pink).
- A bullish ABC (green) pattern is unfolding within that wave 4 (pink).
- The breakout marks the end of wave B (green) and the start of wave C (green).
- Wave C (green) could test the previous top and 23.6% Fibonacci level.
- Price action could go as high as the 38.2% Fibonacci level within wave 4 (pink).
- A larger bullish retracement, however, would make the bearish Elliott Wave analysis unlikely.
(Click on image to enlarge)
GBP/USD Facing Strong Resistance at 38.2% Fib
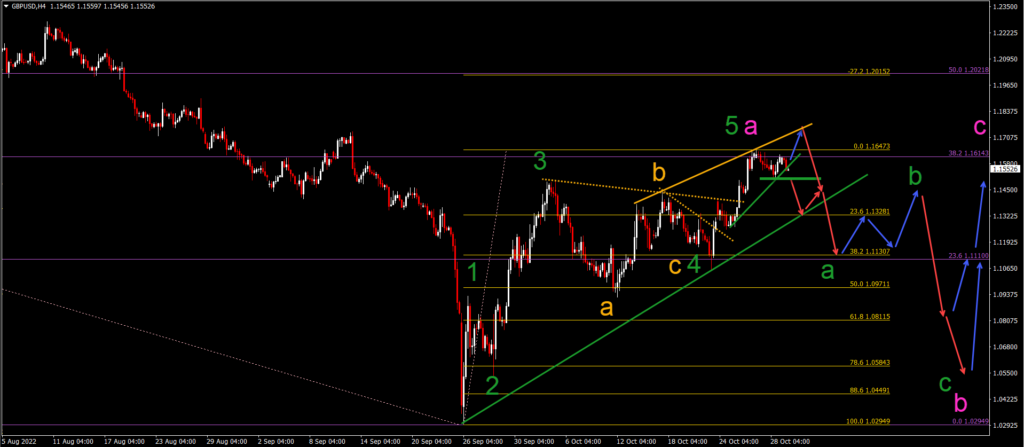
The GBP/USD is completing a bullish 5-wave pattern upwards (green):
- The GBP/USD seems to be losing its bullish momentum at the 38.2% Fib resistance (purple).
- The last push upward (blue arrow) could complete the rising wedge chart pattern.
- A bearish breakout (red arrow) below the support (green) line marks the end of wave 5 (green) of wave A (pink) and the start of the bearish ABC (green) in wave B (pink).
- The bearish wave A (green) should reach the 38.2% Fibonacci level.
- The bearish wave C (green) should reach the 50-61.8% Fibonacci level or lower.
- Once the ABC (green) is completed in wave B (pink), a bullish wave C (pink) should take price action higher again in a larger wave 4.
(Click on image to enlarge)
More By This Author:
ECB Doubled Key Interest Rates, What’s Next?How You Can Gain Exposure To Weaker JPY & Stronger Nikkei
Key Market Insights October 25
Disclaimer: CFDs are complex instruments and come with a high risk of losing money rapidly due to leverage. On average around 80% of retail investor accounts loose money when trading with high ...
moreComments
Please wait...
Comment posted successfully
No Thumbs up yet!


