
Weekly Waves: EUR/USD, GBP/USD And Bitcoin - Monday, May 23
Our weekly Elliott Wave analysis reviews the EUR/USD 4-hour chart, GBP/USD 4-hour chart, and the Bitcoin cryptocurrency weekly chart.
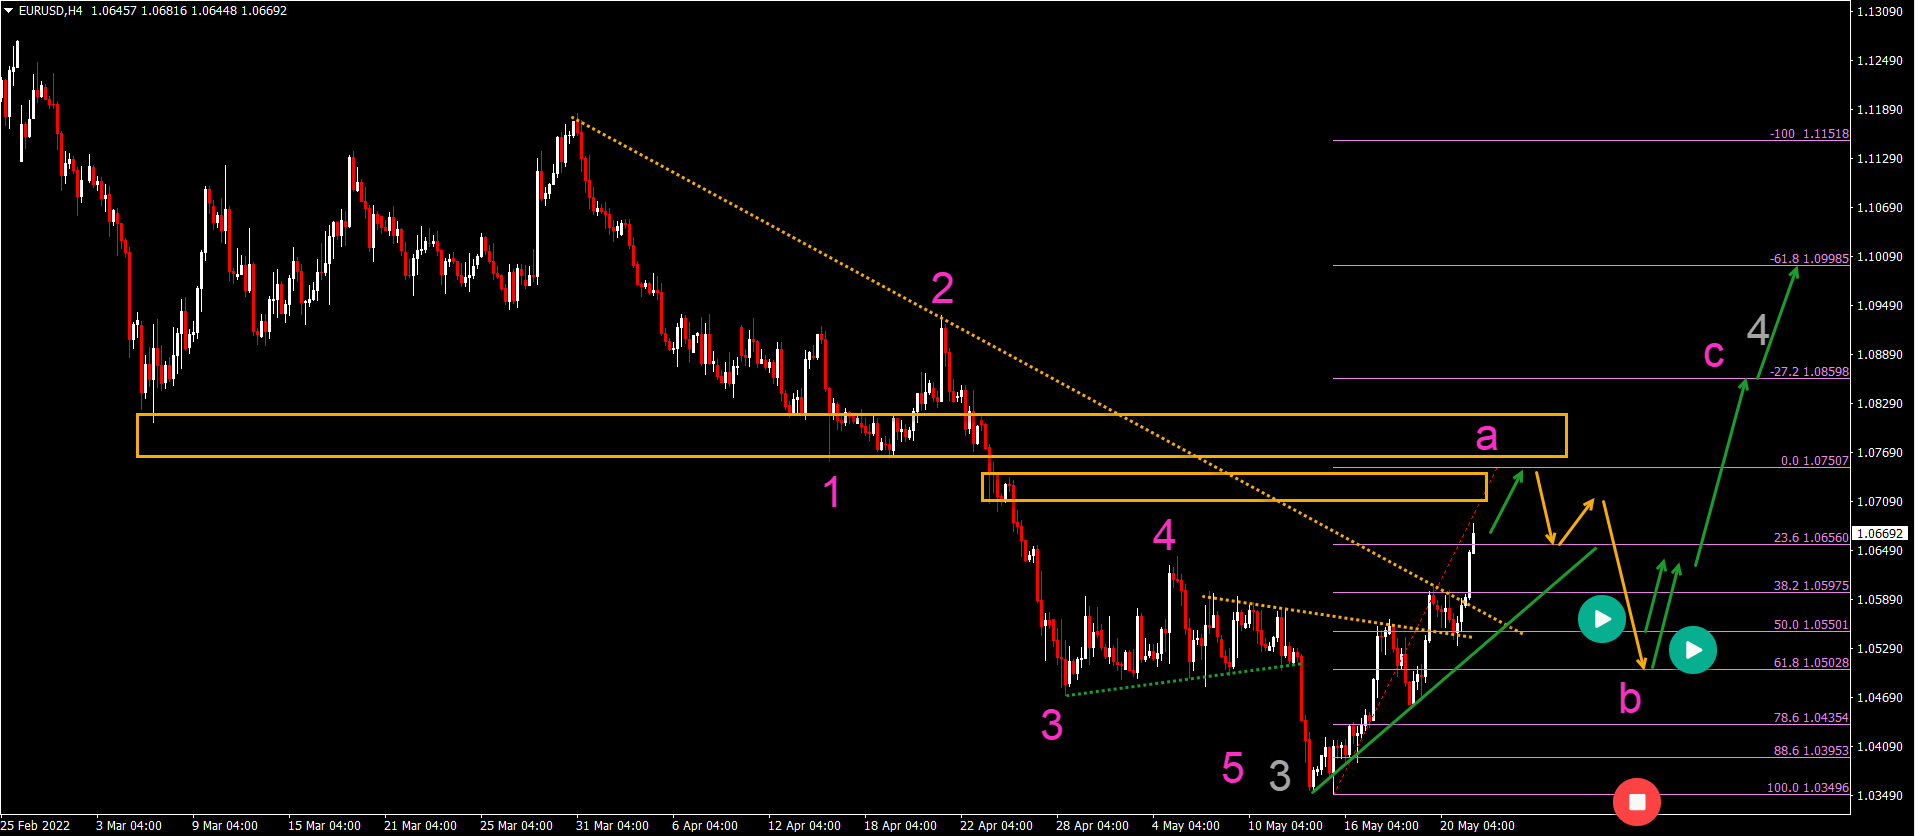
EUR/USD Aiming for 1.10 Bullish Target
The EUR/USD is breaking above the resistance trend lines (dotted orange). Let’s review what this means for the EUR/USD:
- The EUR/USD bullish breakout is indicating the end of the current downtrend and the bearish price swing (wave 3 gray).
- A bullish ABC (pink) pattern is expected. This is probably within wave 4 (gray).
- The wave A (pink) is expected to aim and stop at a resistance zone around 1.0750-1.08.
- A bearish ABC pullback (orange arrows) should take price back down again to the 50-61.8% Fibonacci support zone.
- A bullish bounce (green arrows) at the 50-61.8% Fibonacci level should see another bullish swing take price up to the Fibonacci targets as high as 1.10.
(Click on image to enlarge)
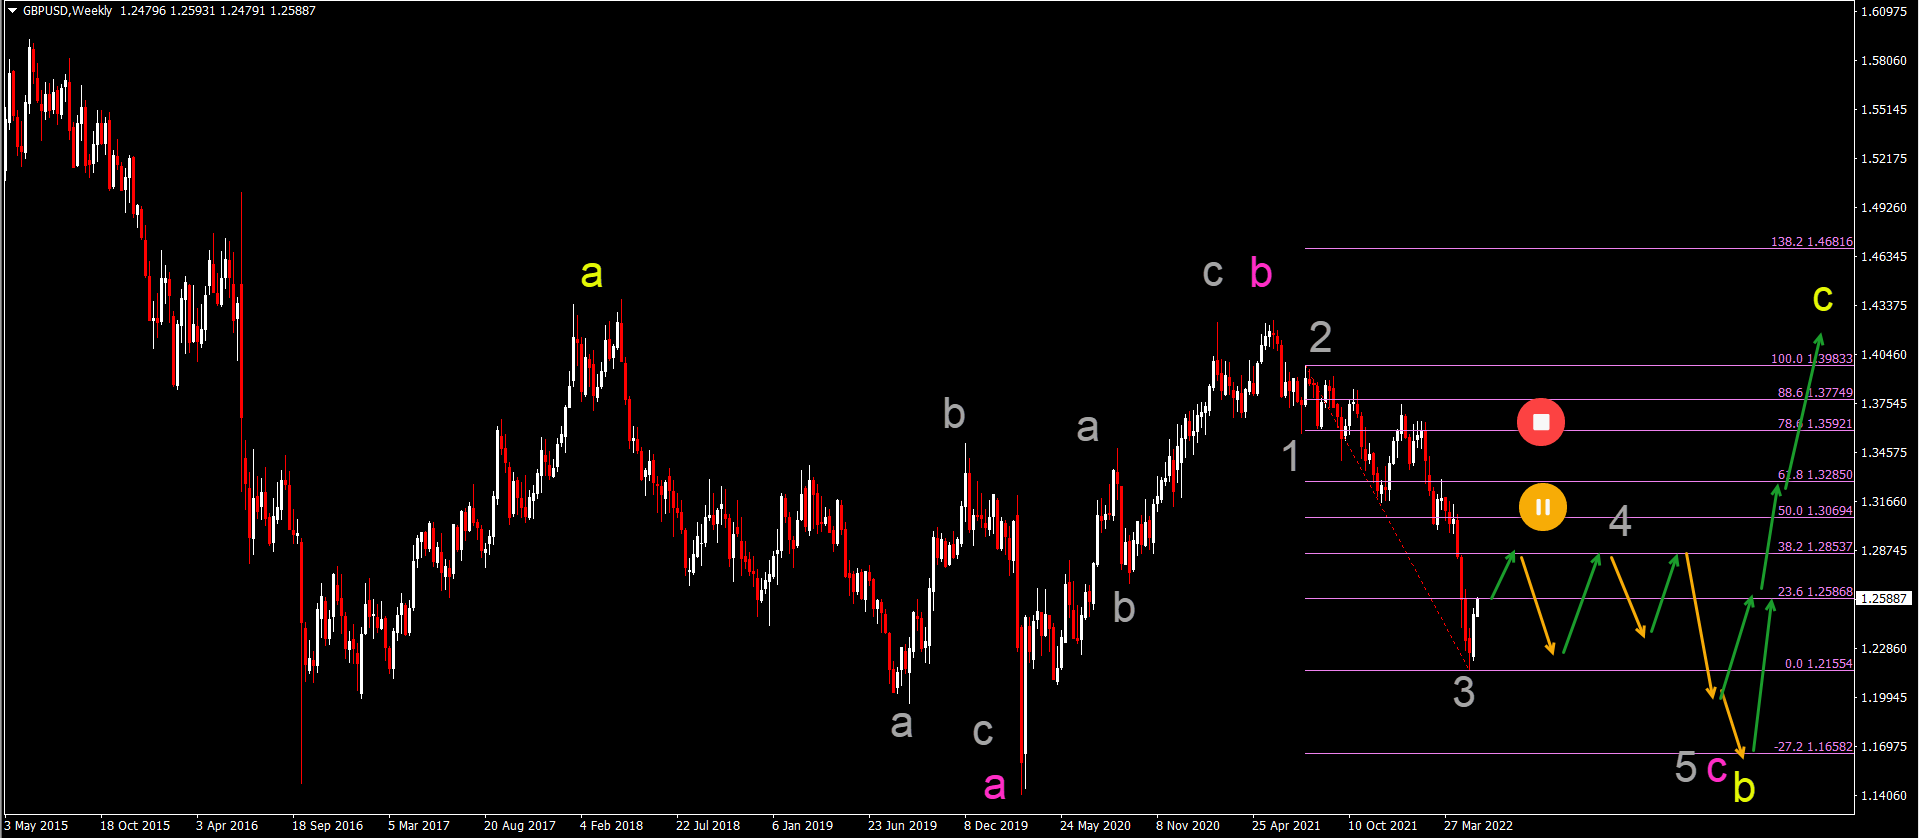
GBP/USD Bearish Wave 3 Completed
The GBP/USD is testing the historical lows and support zone:
- The GBP/USD bearish decline has been very impulsive so far.
- The recent candlestick pattern on the weekly chart shows a strong bullish weekly candle. This could indicate that the wave 3 (gray) is completed.
- If the wave 4 (gray) has indeed started, then price action could build a lengthy and choppy correction which should usually stay below the 50% Fibonacci level.
- A break above the 50-61.8% Fibonacci level makes the bearish wave 4-5 (gray) within wave C (pink) unlikely. In that case, a bullish swing is expected.
- After the correction is completed, one more bearish price swing should create a new lower low to complete wave 5 (gray) of wave C (pink).
- An ABC (pink) pattern seems to be completing a wave B (yellow) of a larger ABC (yellow).
(Click on image to enlarge)
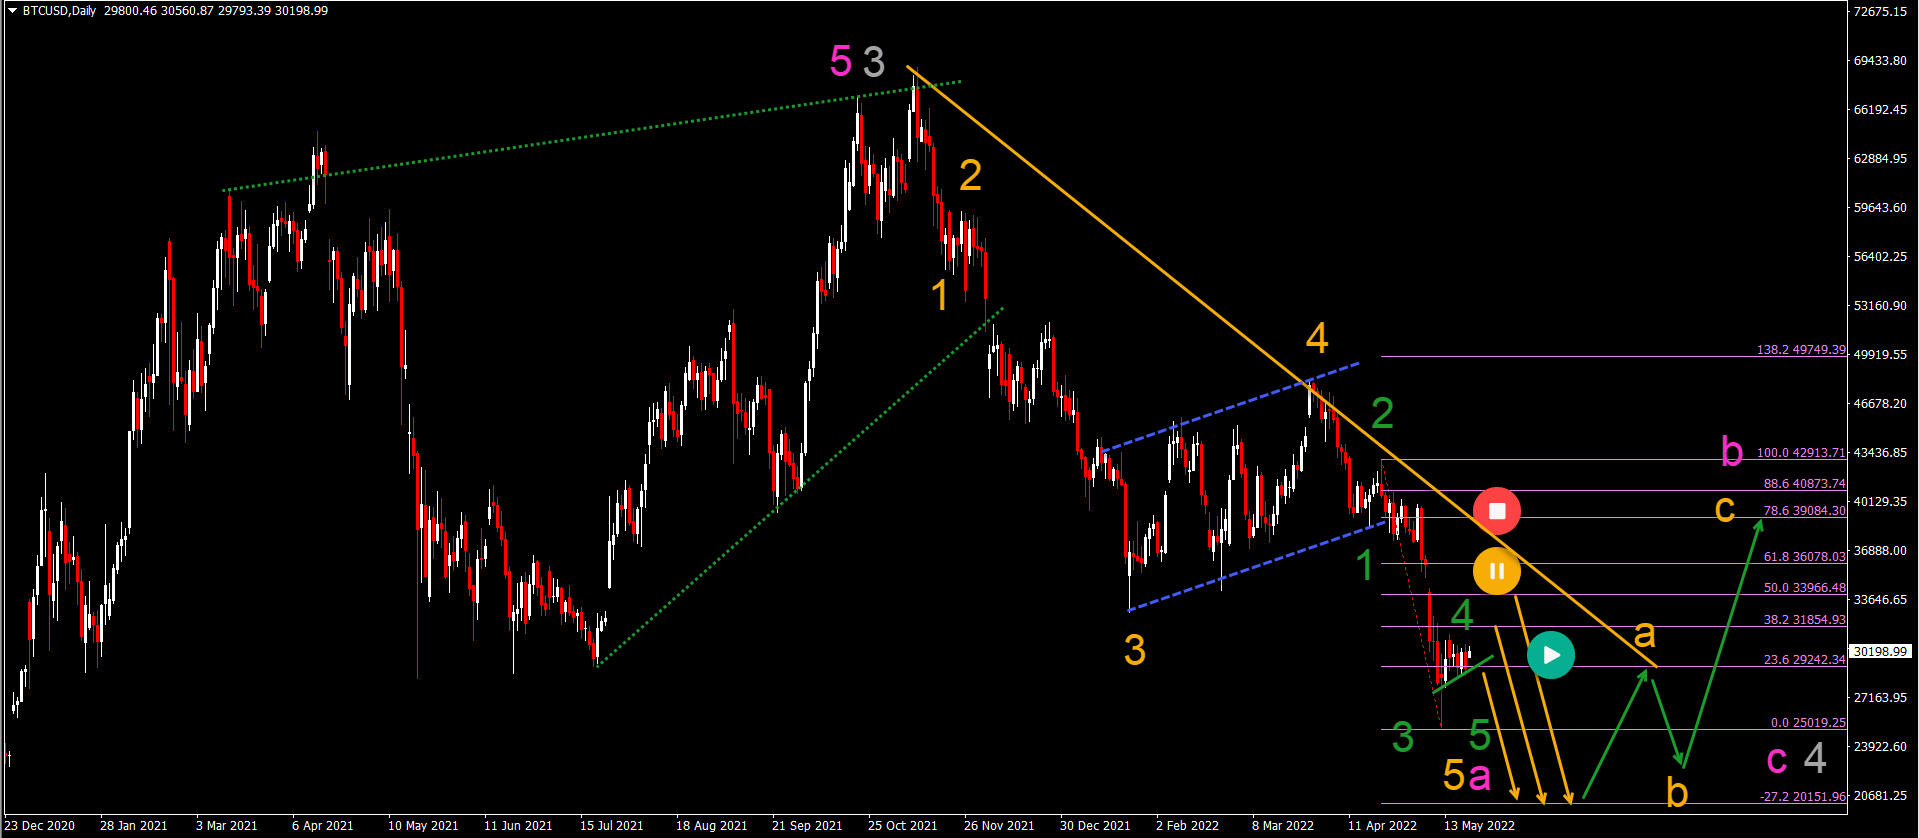
BTC/USD Approaches the End of Bearish Correction
Bitcoin (BTC/USD) is building a mild bullish correction within a strong downtrend:
- The BTC/USD topped out at the all-time high after building a rising wedge reversal chart pattern (dotted green lines).
- Since creating that top, the bearish decline has been strong. The bearish swing seems to be unfolding in 5 waves (orange).
- The recent bear flag pattern (dotted blue lines) was probably part of a wave 4 (orange).
- The current correction seems to be a wave 4 (green) of a wave 5 (orange) of a larger ABC correction (pink) in wave 4 (gray).
- Keep in mind that the ABC (pink) could be part of a wave W of a larger WXY complex correction.
- As long as price action respects the Fibonacci 38.2-50% resistance levels, one more lower low is still expected. After that, a bullish bounce (green arrows) could emerge.
- A break above the resistance line (orange) could indicate an immediate uptrend.
(Click on image to enlarge)
Disclaimer: CFDs are complex instruments and come with a high risk of losing money rapidly due to leverage. On average around 80% of retail investor accounts loose money when trading with high ...
more
How did you like this article? Let us know so we can better customize your reading experience.

Comments
Leave a comment to automatically be entered into
our contest to win a free Echo Show.

