
Our weekly Elliott Wave analysis reviews the EUR/USD, the Bitcoin cryptocurrency, and US30.
Please keep in mind though that many of the price movements, however, will depend on the geopolitical moves concerning Russia and Ukraine.
EUR/USD Triangle Pattern Prepares for Drop
The EUR/USD was building a triangle pattern in our Elliott Wave analysis from last week before making a final drop to 1.10. What would the decline indicate?
- A bearish decline (orange arrow) is expected to test the support trend line (blue) of the triangle chart pattern on the weekly time frame.
- A bullish bounce (green arrow) at the support zone (blue) could confirm a wave D (pink) of a larger ABCDE (pink) pattern.
- The wave E may not break above the previous top otherwise this pattern is invalid. A break above the resistance (red) line makes the bearish ABCDE pattern less likely.
- A break below the previous bottom before wave E is built indicates an immediate downtrend via wave 3.
- Wave E should have 3 sub-waves in the pattern. A bearish reversal should take price action lower (red arrow).
(Click on image to enlarge)

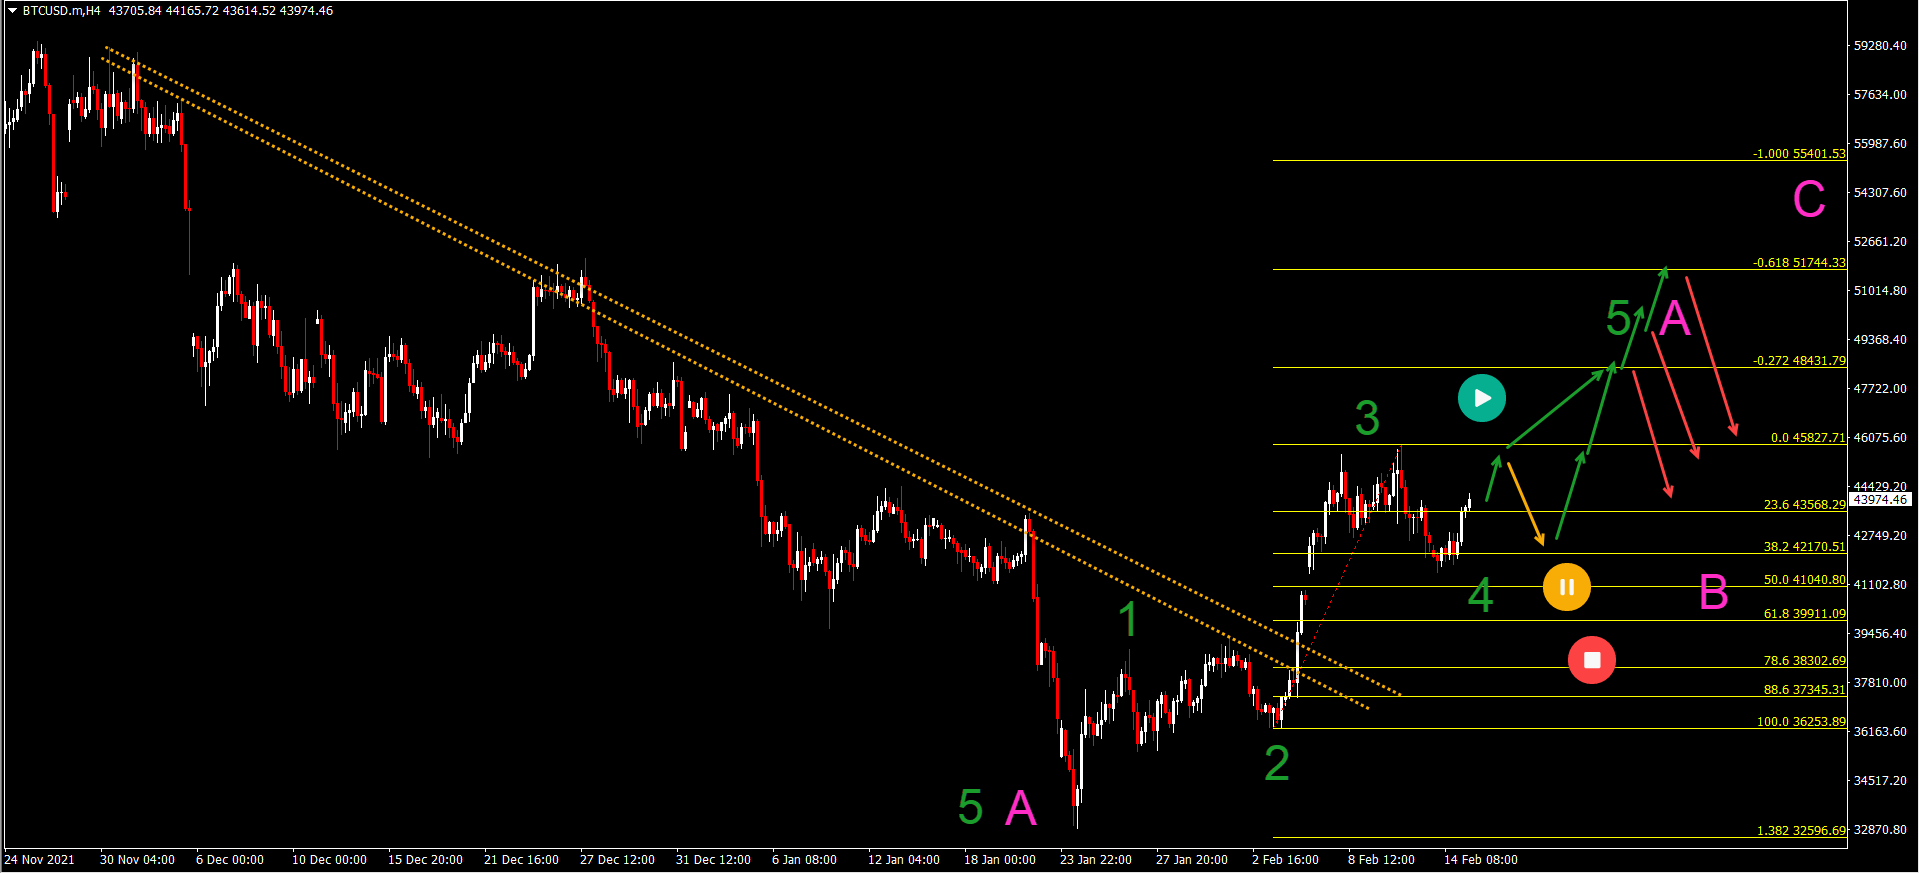
BTC/USD Ready for ABC Upward
The Bitcoin crypto pair (BTC/USD) is showing signs of a short-term bullish reversal:
- BTC/USD managed to break above the resistance trend lines (dotted orange).
- The strong bullish price swing is probably a wave 3 (green) as long as the retracement remains shallow within wave 4 (green).
- A deep bearish retracement however invalidates the bullish outlook and would change the 123 pattern into an ABC pattern.
- A bullish break higher confirms wave 5 (green). The main targets are the Fibonacci levels.
- Price action could make a bearish pullback via wave B (pink) in a larger ABC (pink) pattern.
(Click on image to enlarge)
US30 Daily Chart Remains “Messy”
The US 30 remains choppy with many price movements up and down:
- The daily chart uptrend has been slowing down significantly in recent months – although the uptrend did manage to continue at a shallow angle (trend channel blue and orange).
- The bearish breakout below the channel could be the first indication of a larger bearish retracement. We marked this for the moment as a wave A (pink).
- A bullish retracement (green arrow) could be a wave B (pink) as long as price action respects and stays below the top.
- A head and shoulders reversal chart pattern (orange boxes) could kick start the end of wave B (pink) and the start of wave C (pink).
- A re-brake below the support trend line would confirm the bearish price swing and wave C (pink).
(Click on image to enlarge)


Comments
Log in or sign up to join the conversation.