

Image Source: Unsplash
USDNOK is trading sideways for a while, but slow price action and sideways wave structure are normally a consolidation within an ongoing bearish trend. From a technical point of view, we can see it forming a nice Head & Shoulders pattern, which can be now finishing a right shoulder, the final pattern before a bearish continuation.
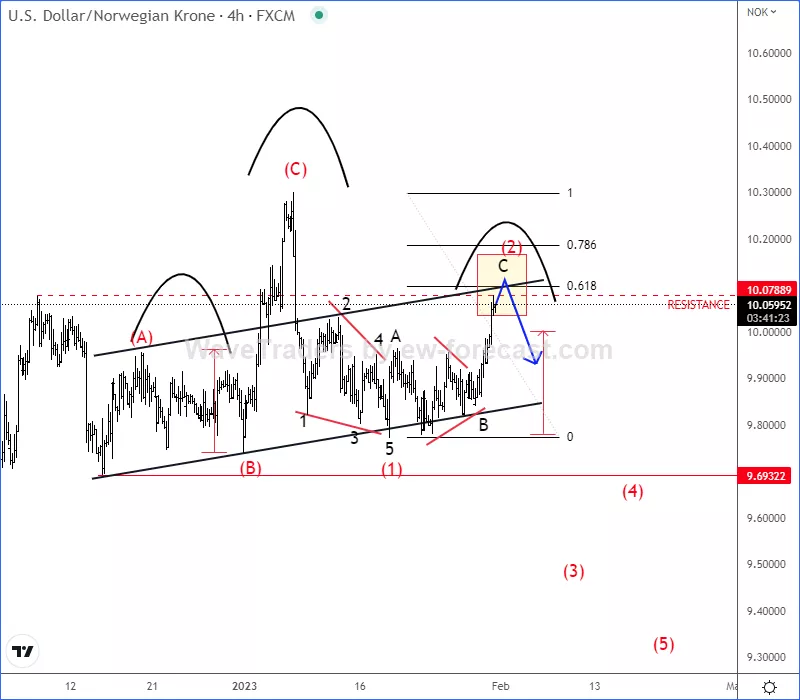
If we also consider a bearish setup from the Elliott wave perspective, where we see it forming a leading diagonal in wave (1), followed by a three-wave A-B-C correction in wave (2), then we should be aware of a bearish resumption within wave (3) of a new five-wave bearish cycle soon. Nice technical resistance is here around 10 level, but bearish confirmation is only below the neckline of H&S pattern and 9.8 region. The invalidation level is at 10.30.
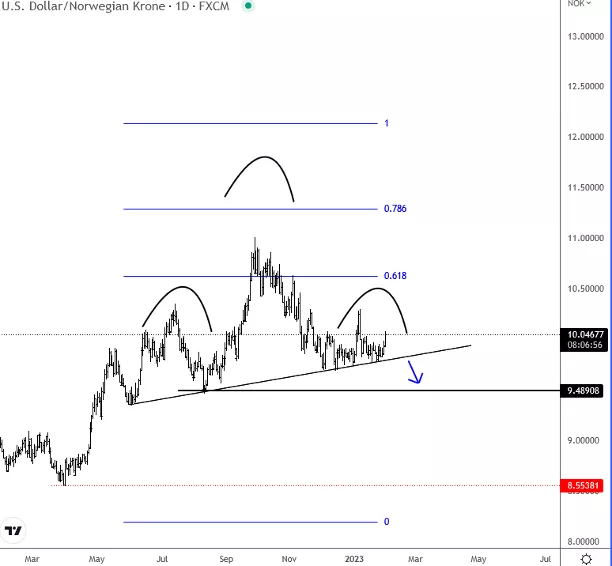
If USDNOK suddenly rallies and breaks the short-term 10.30 invalidation level, then the next resistance will be at 10.50, but still with a nice daily bearish H&S pattern.
Happy trading!
More By This Author:
Bitcoin May Face A Correction: Elliott Wave Intraday Analysis
CADJPY Is Unfolding A Bearish Impulse; Nice Short Can Be From 100 Level
Ethereum Is Pointing Higher


Comments
Log in or sign up to join the conversation.