

Image Source: Unsplash
USD/NOK is sideways for the last two years which looks like a larger triangle within uptrend. It's an ABCDE pattern where wave E can be in play as pair stops at the upper side of this contracting range.
(Click on image to enlarge)
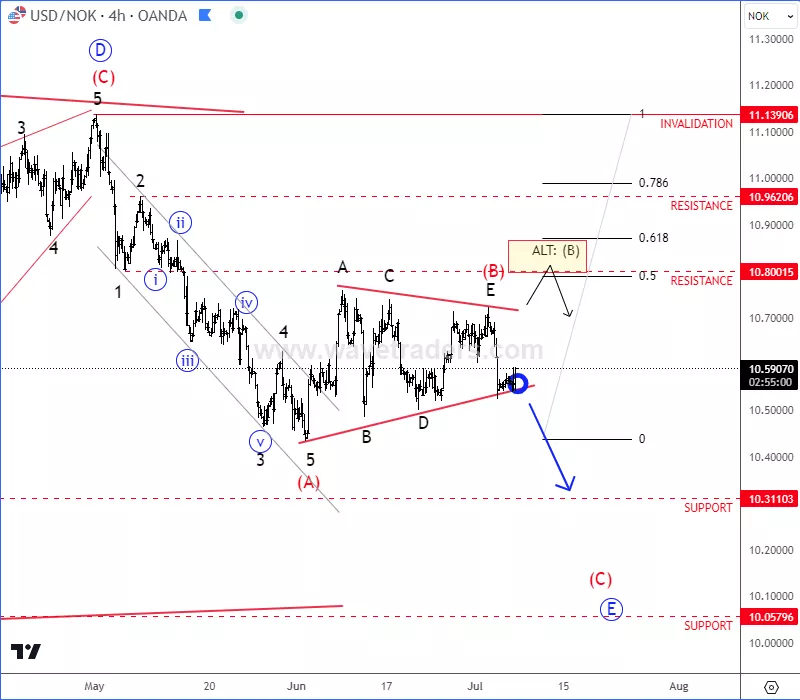
Ideally, the market is coming down for a pullback within higher degree wave E, where pair can complete the sideways price pattern. So for now, seems like there is room for more weakness within a three-wave (A)-(B)-(C) decline to the lower side of a range.
Wave (B) looks to be a bearish triangle pattern unless it's going to be more complex, but sooner or later it can send the price lower within wave (C) of E towards to 10.30/10.00 support area.
One of the reasons why USD/NOK could face more weakness is also bullish-looking Crude oil, which can boost the Norwegian Krone.
More By This Author:
AUDNZD: Aussie Outperfoms Kiwi As Australian Inflation Gets Hot
SP500 Has An Unfinished Five-Wave Bullish Rally
Cardano Steps Into A Higher Degree Corrective Setback


Comments
Log in or sign up to join the conversation.