
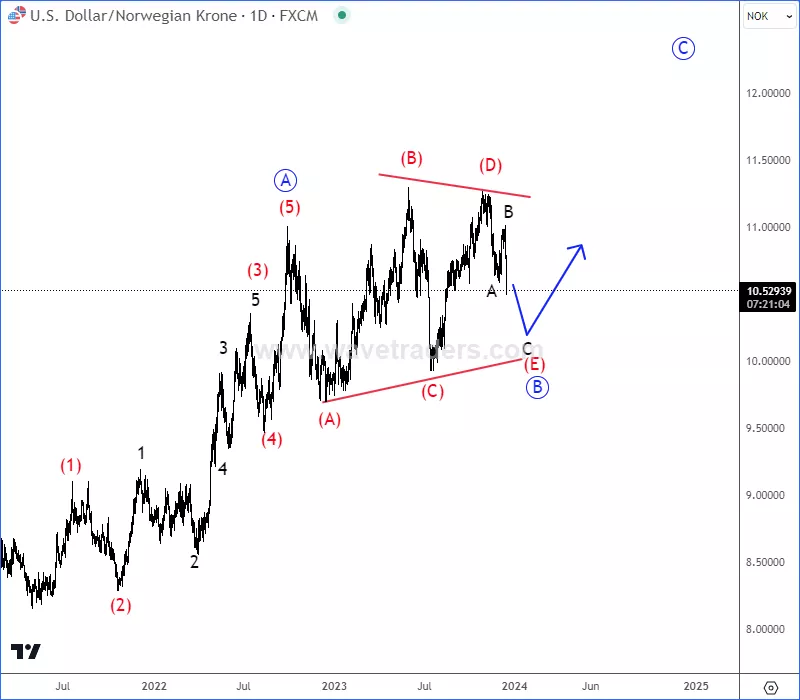
Since the beginning of 2023, USDNOK is trading in sideways consolidation that can be a corrective (A)-(B)-(C)-(D)-(E) running triangle pattern within wave B before we will see a bigger recovery for wave C of B. On a daily chart it can be now slowing down within final subwave (E) that can retest lower triangle line near 10.0 support level.
(Click on image to enlarge)
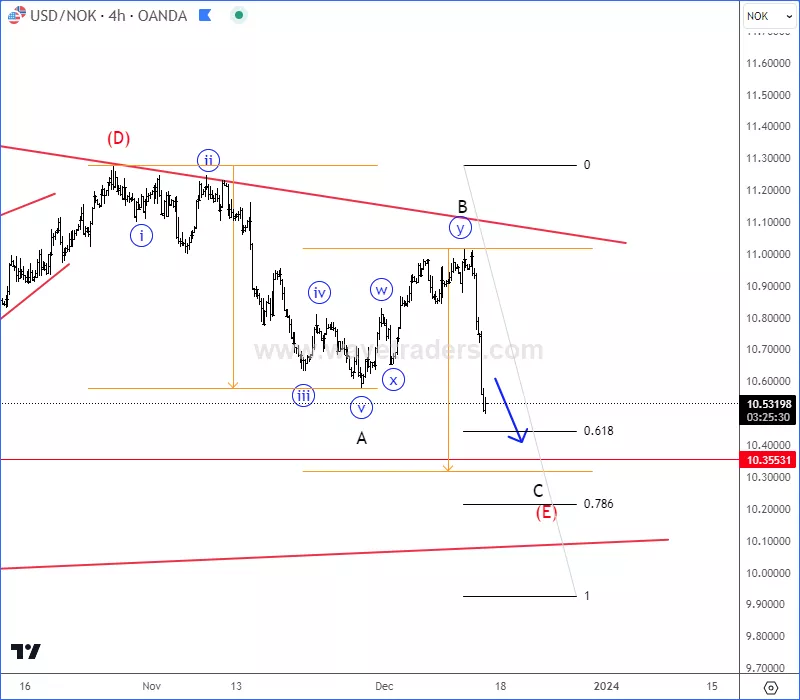
Looking at the 4-hour chart, USDNOK is coming down within a three-wave A-B-C decline for a higher degree wave (E) as expected. Currently we are already tracking wave C of (E), but there can be room down to 10.30 – 10.20 area before it finds the support.
(Click on image to enlarge)
More By This Author:
Bank Sector Is Waking Up
NZDUSD Is Recovering In An Impulsive Fashion
GBPJPY Is Turning Sharply From Strong Resistance


Comments
Log in or sign up to join the conversation.