USDJPY’s Impulsive Bullish Pattern Points To Continued Upside

Image Source: Pixabay
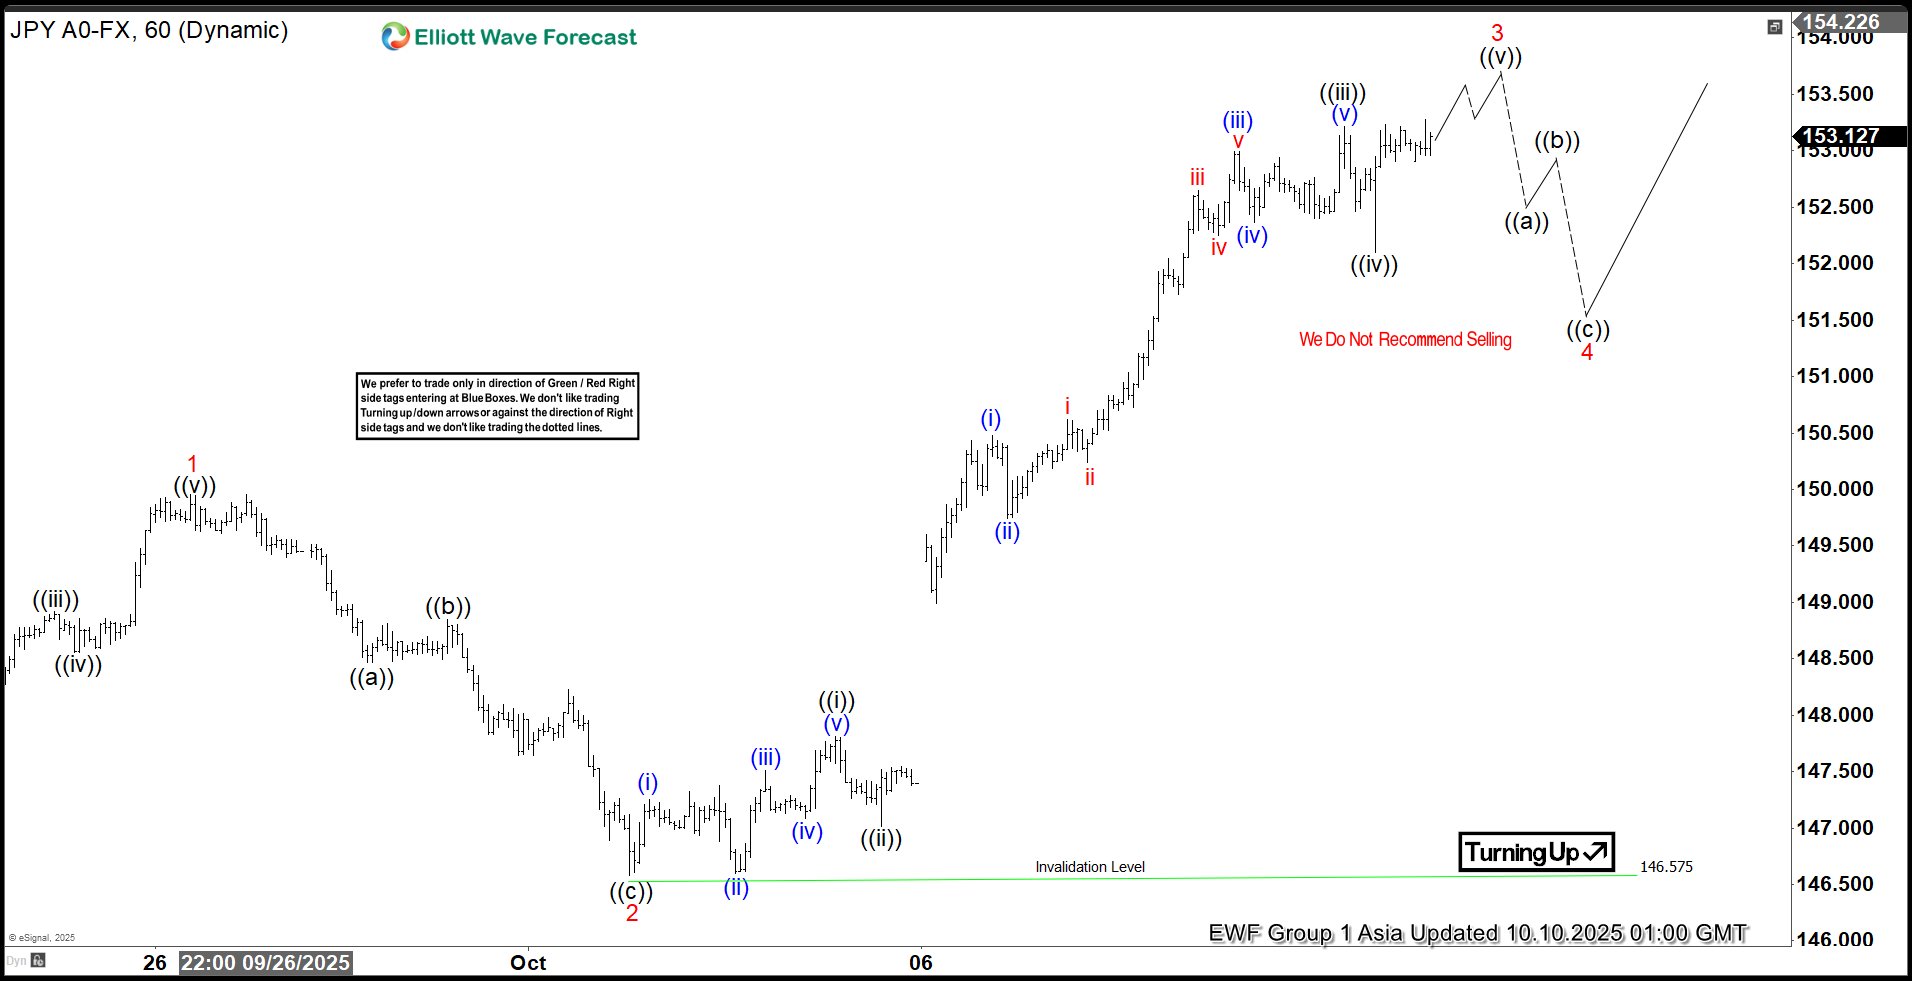
The short-term Elliott Wave analysis for USDJPY indicates that the cycle starting from the September 18, 2025 low is unfolding as a five-wave impulse. From that low, wave 1 peaked at 149.956, followed by a wave 2 pullback structured as a zigzag. In this correction, wave ((a)) declined to 148.467, wave ((b)) rallied to 148.85, and wave ((c)) concluded at 146.57, finalizing wave 2 at a higher degree.
The pair has since resumed its upward trajectory in wave 3. From the wave 2 low, wave ((i)) reached 147.81, followed by a brief pullback in wave ((ii)) to 147.01. The pair then advanced in wave ((iii)) to 153.21, with a minor dip in wave ((iv)) concluding at 152.09. Analysts anticipate the pair will extend higher in wave ((v)) to complete wave 3. Following this, a wave 4 pullback is expected to correct the cycle from the October 1, 2025 low before the pair resumes its upward movement. In the near term, as long as the pivot low at 146.57 holds, any wave 4 pullback should attract buyers in a 3, 7, or 11 swing pattern, supporting further upside. This analysis suggests a bullish outlook with key support levels intact.
USDJPY – 60 Minute Elliott Wave Technical Chart:
USDJPY – Elliott Wave Technical Video:
Video Length: 00:03:33
More By This Author:
Elliott Wave Analysis: Nvidia’s Leading Diagonal Pattern Targets $193Elliott Wave Forecast: SPDR S&P 500’s Path To Record Peaks
Nasdaq On Track For Higher Wave 5 Finish
Disclaimer: Futures, options, and over the counter foreign exchange products may involve substantial risk and may not be suitable for all investors. Leverage can work against you as well as for ...
more


