
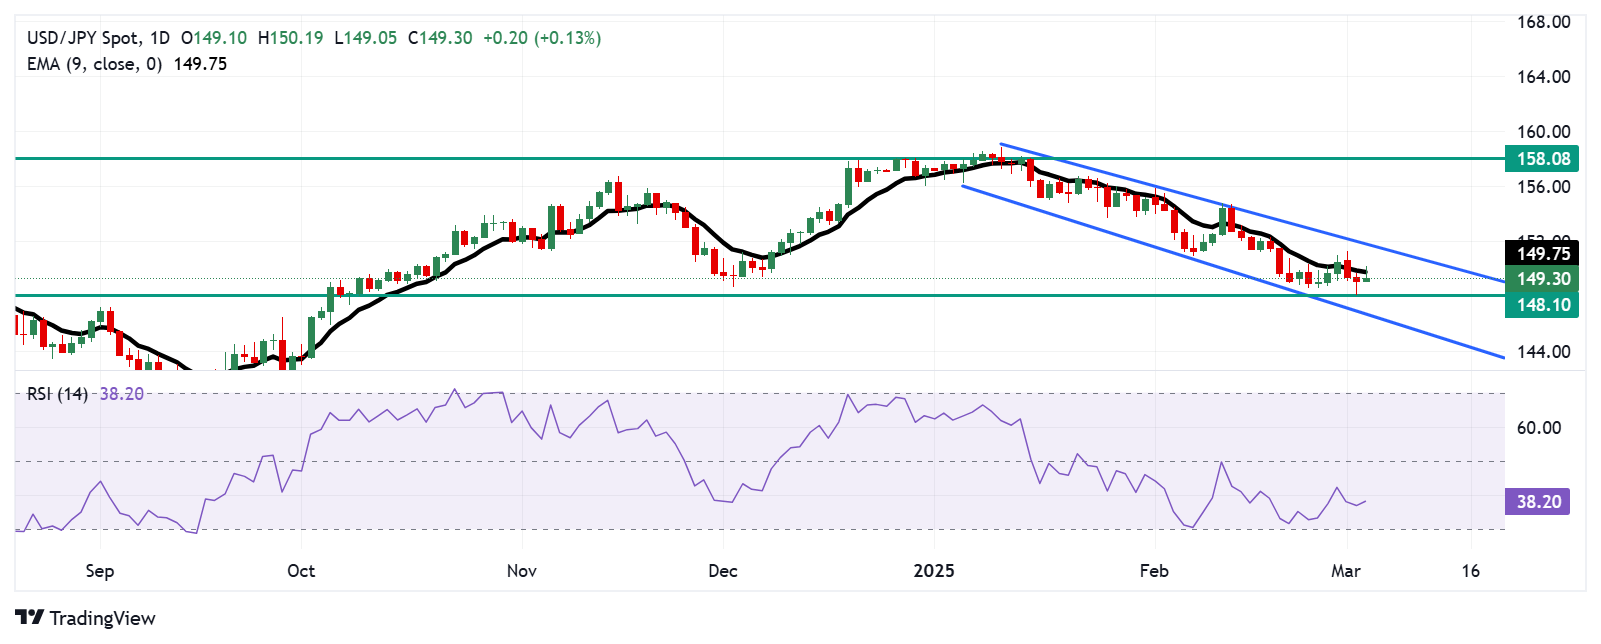
- USD/JPY could aim for initial support at the five-month low of 148.10.
- The pair continues to decline within a descending channel, reinforcing a confirmed bearish bias.
- The nine-day EMA at 149.75 serves as an immediate resistance level.
USD/JPY gains ground after registering losses in the previous two successive days, trading around 149.40 during the European session on Wednesday. An analysis of the daily chart showed the USD/JPY pair moves downward within a descending channel, indicating a confirmed bearish bias.
The USD/JPY pair remains below the nine-day Exponential Moving Average (EMA), indicating a weaker short-term price momentum. Additionally, the 14-day Relative Strength Index (RSI), a momentum indicator, is positioned above the 30 level, reinforcing the persistent bearish bias.
In terms of support, the USD/JPY pair could target the five-month low at 148.10, recorded on March 4, followed by the psychological level of 148.00. A successful breach below this crucial support zone could reinforce the bearish bias and put pressure on the pair to test the lower boundary of the descending channel at the level of 146.70
On the upside, the USD/JPY pair could first encounter the nine-day EMA barrier at 149.75. A break above this level could improve the short-term price momentum and support the pair to approach the descending channel’s upper boundary at the 152.00 level.
USD/JPY: Daily Chart
(Click on image to enlarge)
More By This Author:
Gold Price Declines As US Dollar Strengthens During Trump's Congressional SpeechUS Dollar Index Breaks Below 106.50 Despite Risk-Off Sentiment Due To Global Tariff Fears
AUD/JPY Falls Toward 93.00 Due To Hawkish Sentiment Surrounding The BoJ’s Policy Outlook


Comments
Log in or sign up to join the conversation.