USD/JPY Price Analysis: Plummets Below Ichimoku-Cloud, Eyes Further Downside

Image Source: Pixabay
- USD/JPY drops below Ichimoku Cloud, first since January 15, hinting at possible extended downtrend.
- Bearish RSI suggests further falls; supports at 155.00, 154.55, 151.86.
- Resistance at 156.33; breach may push to 157.00, potentially reversing trend.
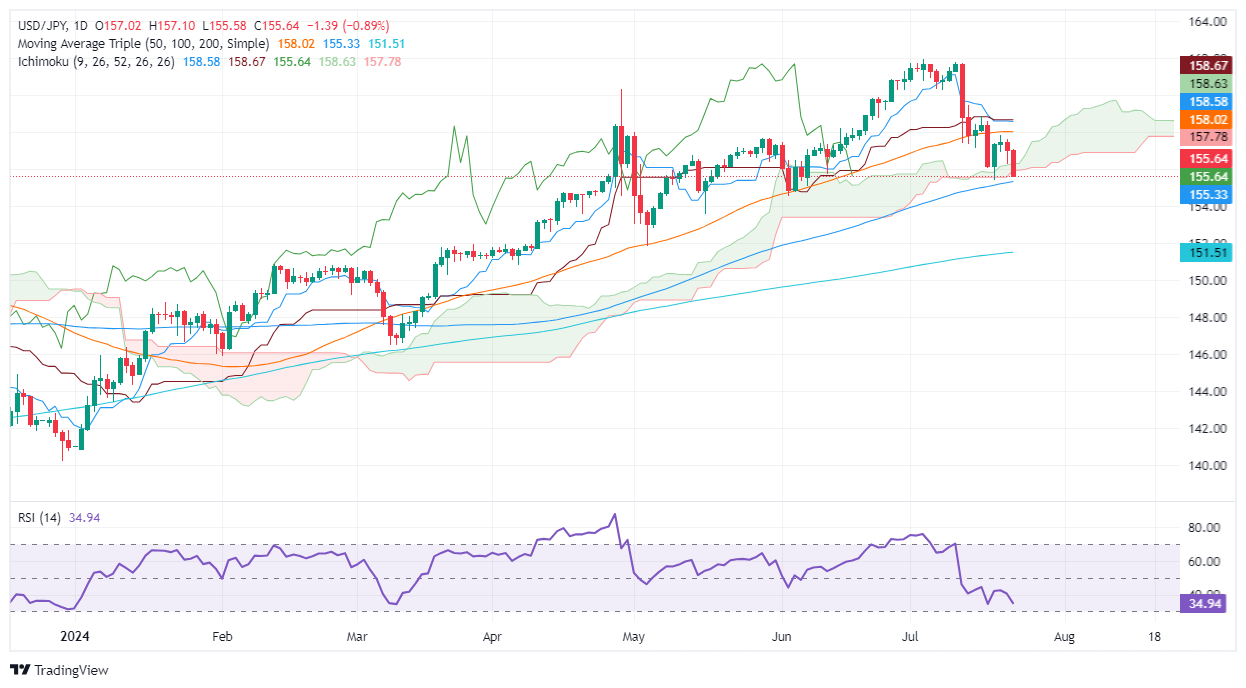
The USD/JPY plummets over 0.85% and drops below the Ichimoku Cloud (Kumo) for the first time since January 15. This is an important milestone yet pending to be confirmed by a daily close below 155.90. At the time of writing, the pair trades at 155.65 after hitting a daily high of 157.10.
USD/JPY Price Analysis: Technical outlook
The USD/JPY is set to extend its losses if it achieves a daily close below the Kumo. This would be the fifth technical signal using Ichimoku to confirm the downtrend, which could pave the way for a deeper pullback.
Momentum favors sellers as depicted by the Relative Strength Index (RSI) aiming lower beneath the 50-neutral line.
Therefore, the USD/JPY path of least resistance is tilted to the downside. the first support would be the 155.00 figure. A breach of the latter will expose the June 4 low of 154.55, followed by the May 3 bottom at 151.86. Further losses are seen under that level, like the March 8 low at 146.48.
On the other hand, if buyers lift the exchange rate past the top of the Kumo at 156.33, that can open the door for a leg-up. The next resistance would be 157.00.
USD/JPY Price Action – Daily Chart
More By This Author:
Gold Price Falls Below Key Support As US Yields Climb
Silver Price Analysis: XAG/USD Plummeted More Than 2% And Dropped Below $29.50
Gold Price Stumbles Beneath $2,400 Drops To Five-Day Low
Disclaimer: Information on these pages contains forward-looking statements that involve risks and uncertainties. Markets and instruments profiled on this page are for informational purposes only ...
more


