
- USD/JPY falls to near 150.00 amid a sell-off in the USD Index.
- Fed policymakers warned that over-focusing on a one-time inflation increase could be a tremendous mistake.
- The BoJ may postpone plans of exiting the expansionary monetary policy stance.
The USD/JPY pair falls slightly below the psychological support of 150.00 in the early New York session on Tuesday. The asset has faced selling pressure as the US Dollar Index (DXY) has extended its downside to 104.00.
The USD Index has dropped to a weekly low as Federal Reserve (Fed) policymakers are confident that inflation is in the right direction despite a one-time stubborn-than-anticipated consumer price inflation data for January.
Fed policymakers advised that over-focusing on one-time blips in inflation data could be a tremendous mistake. As per the CME FedWatch tool, investors see interest rates remaining unchanged in the range of 5.25%-5.50% till the July policy meeting as the Fed needs more good inflation data for months.
The Japanese Yen performs better against the US Dollar despite easing hopes for the Bank of Japan (BoJ) quitting the decade-long ultra-dovish monetary policy stance. The Japanese Yen entered a recession in the second half of 2023. The situation of a poor domestic economy is an unfavorable situation for exiting the expansionary policy stance.
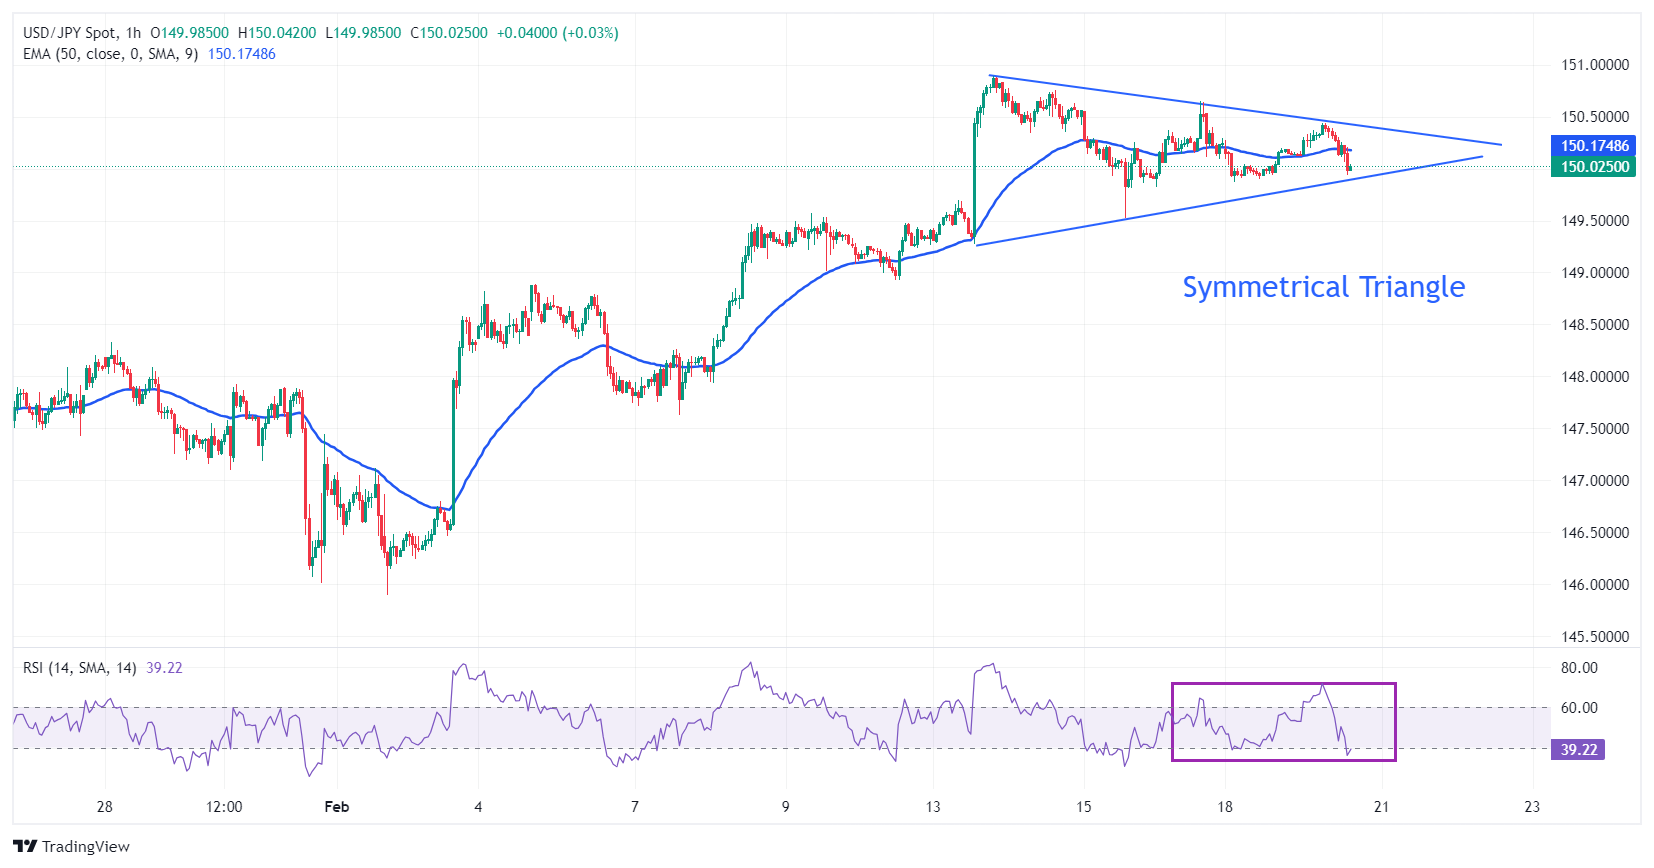
USD/JPY oscillates in a Symmetrical Triangle formation on an hourly time frame. The upward and downward-sloping borders of the aforementioned chart pattern are plotted from February 13 low and high at 149.27 and 150.88, respectively.
The triangle could breakout in either direction, however, the odds marginally favor a move in the direction of the trend before the formation of the triangle – in this case up.
The 50-period Exponential Moving Average (EMA) around 150.20 remains sticky to spot prices, indicates indecisiveness among market participants.
Going forward, a decisive break above February 13 high at 150.88 would drive the asset towards November 16 high at 151.43, followed by November 13 high at 151.90.
On the flip side, a breakdown below February 13 high at 149.27 would drag the asset towards February 5 high at 148.90. Breach of the latter would expose the asset to January 29 high at 148.32.
USD/JPY hourly chart
(Click on image to enlarge)
USD/JPY
| OVERVIEW | |
|---|---|
| Today last price | 149.95 |
| Today Daily Change | -0.19 |
| Today Daily Change % | -0.13 |
| Today daily open | 150.14 |
| TRENDS | |
|---|---|
| Daily SMA20 | 148.65 |
| Daily SMA50 | 145.91 |
| Daily SMA100 | 147.57 |
| Daily SMA200 | 145.43 |
| LEVELS | |
|---|---|
| Previous Daily High | 150.28 |
| Previous Daily Low | 149.88 |
| Previous Weekly High | 150.89 |
| Previous Weekly Low | 148.93 |
| Previous Monthly High | 148.81 |
| Previous Monthly Low | 140.81 |
| Daily Fibonacci 38.2% | 150.03 |
| Daily Fibonacci 61.8% | 150.12 |
| Daily Pivot Point S1 | 149.92 |
| Daily Pivot Point S2 | 149.7 |
| Daily Pivot Point S3 | 149.52 |
| Daily Pivot Point R1 | 150.32 |
| Daily Pivot Point R2 | 150.5 |
| Daily Pivot Point R3 | 150.72 |
More By This Author:
EUR/USD Attempts To Continue Winning Streak Amid A Subdued US Dollar, Hovers Near 1.0790USD/JPY Gains Ground On Risk-off Mood Ahead Of FOMC Minutes, Improves To Near 150.30
EUR/USD Price Analysis: Retreats From The Weekly High To Near 1.0770


Comments
Log in or sign up to join the conversation.