
USD/JPY Forecast: Symmetrical Triangle Ready To Break To Downside?
The USD/JPY pair dropped significantly in the last hours and now is pressuring a dynamic support. It’s still trapped within a symmetrical triangle, so we’ll have to wait for a valid breakout before taking action.
The price slipped lower as the Dollar Index plunged. Also, the Japanese stock index, the Nikkei, has shown some overbought signals.
Forex day trading on this binary event has proven to be as difficult as ever, with some expecting inflation to show price rises continuing to pick up the pace.
US Inflation Cools A Little
Unfortunately for the US Dollar and those going long, the United States inflation data has come in better than expected (i.e. lower than expected).
The CPI rose only by 0.3% in August versus 0.4% expected and compared to 0.5% in July, while the Core CPI registered a 0.1% growth versus 0.3% forecast and compared to 0.3% in the previous reporting period. This poor US data has punished the Dollar Index, which has dropped as low as 92.32 level.
It remains to be seen what will happen later in the day as the DXY has reached a dynamic support level.
Japanese Revised Industrial Production dropped by 1.5% as expected and tomorrow the US Industrial Production, Empire State Manufacturing Index, Capacity Utilization Rate, and more Japanese data could bring further action on the USD/JPY pair.
USD/JPY Forecast – Price Technical Analysis!
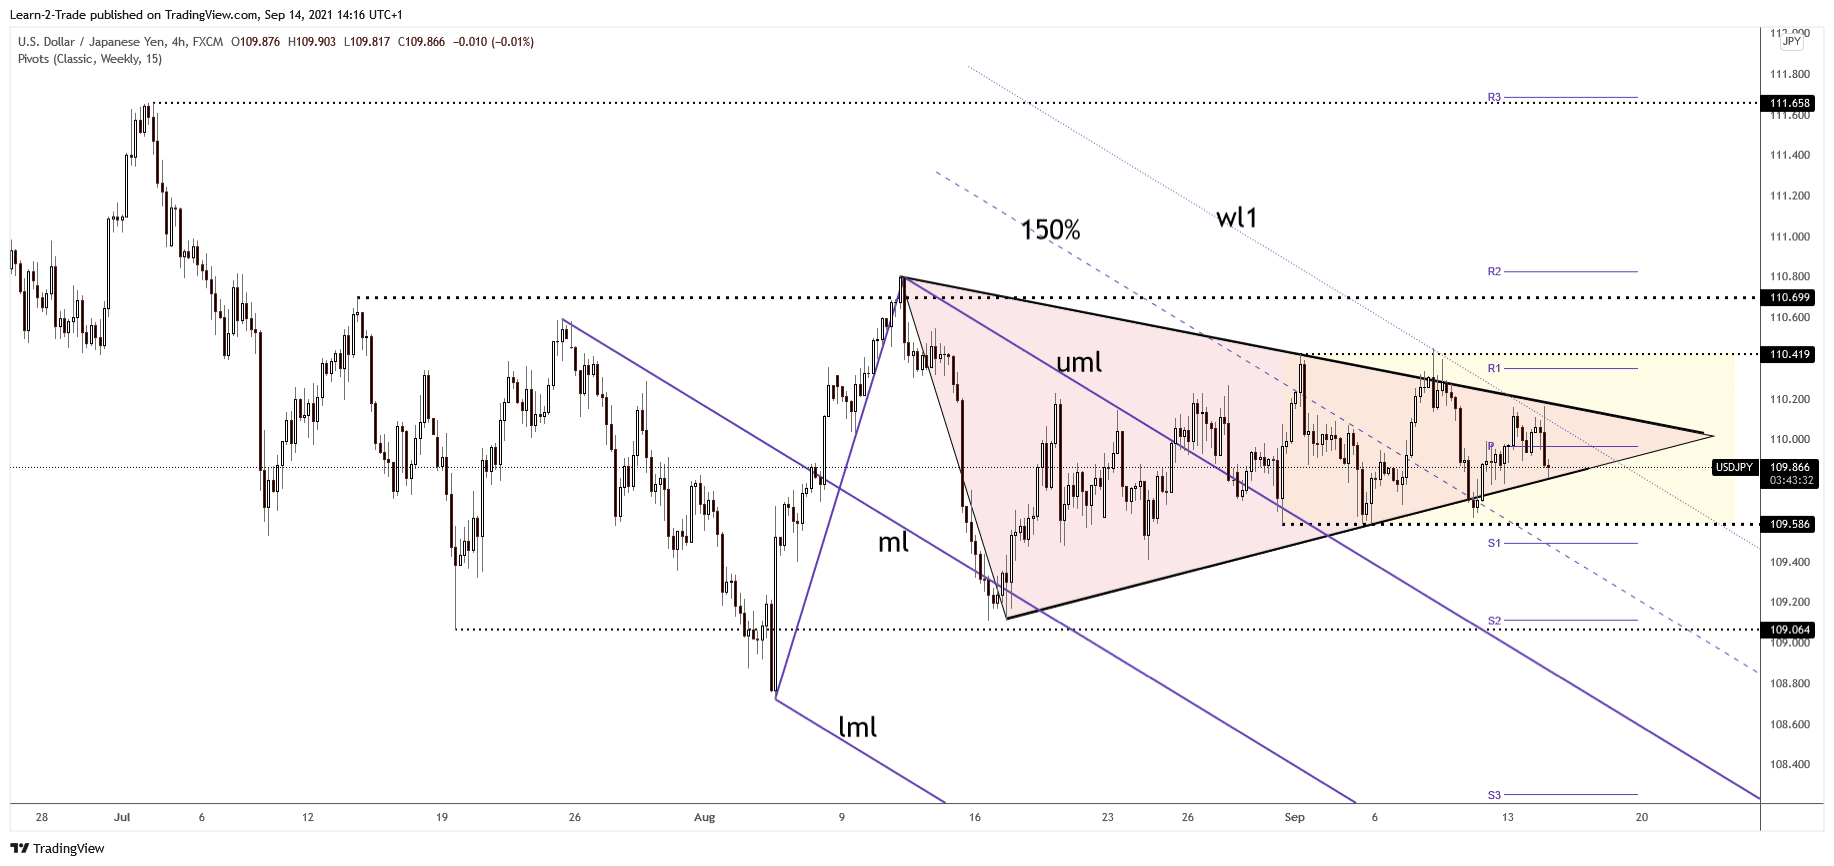
In our USD/JPY forecast we note the failure to retest the triangle’s resistance and now is pressuring the downside line.
It has registered a false breakout with substantial separation through the first warning line (wl1) of the descending pitchfork.
Only a valid breakout from the triangle pattern would be enough to justify going long or short. As you can see on the h4 chart above, the pair is trapped within a range pattern between 109.58 and 110.41 level. A decisive breakout through one of these levels could bring us new trading opportunities.
Technically, registering a false breakdown from this triangle formation could signal a potential upside breakout. It is probably best to wait for the price to escape from the triangle pattern and from the range formation before taking action.
Disclaimer: Foreign exchange (Forex) trading carries a high level of risk and may not be suitable for all investors. The risk grows as the leverage is higher. Investment objectives, risk ...
more

