USD/JPY Dips To Test A Previous Top At 156.60 Following Hot Japanese Inflation
- The Yen trims some losses following higher than expected inflation levels in Japan.
- The hot inflation figures have increased hopes of a BoJ hike in January.
- Technically, the pair is correcting lower, after having reached strongly overbought levels.
The Yen is picking up from five-month lows on Friday, supported by a somewhat softer US Dollar and hot Japanese inflation figures. The Dollar has pulled back from levels right below 158.00 and is testing support at the previous 56.60 resistance area.
Japanese data released on Thursday showed that inflation accelerated to a 2.9% yearly rate in November from 2.3% in October. Likewise, the core inflation increased 2.7% year-on-year, beating expectations of a 2.6% increment. These figures keep hopes of a January hike alive and provide some support to an ailing Yen.
BoJ-Yen divergence has crushed the JPY
The Bank of Japan kept rates unchanged on Thursday and conditioned a further rate hike to the evolution of next spring’s wage negotiations. Investors, who were expecting clearer signs of a January hike, were disappointed and the Yen tumbled against its main rivals.
One day earlier, the Federal Reserve cut interest rates but signalled a slower easing path for next year. The hawkish stance sent the US Dollar and US Treasury yields surging.
USD/JPY Technical analysis
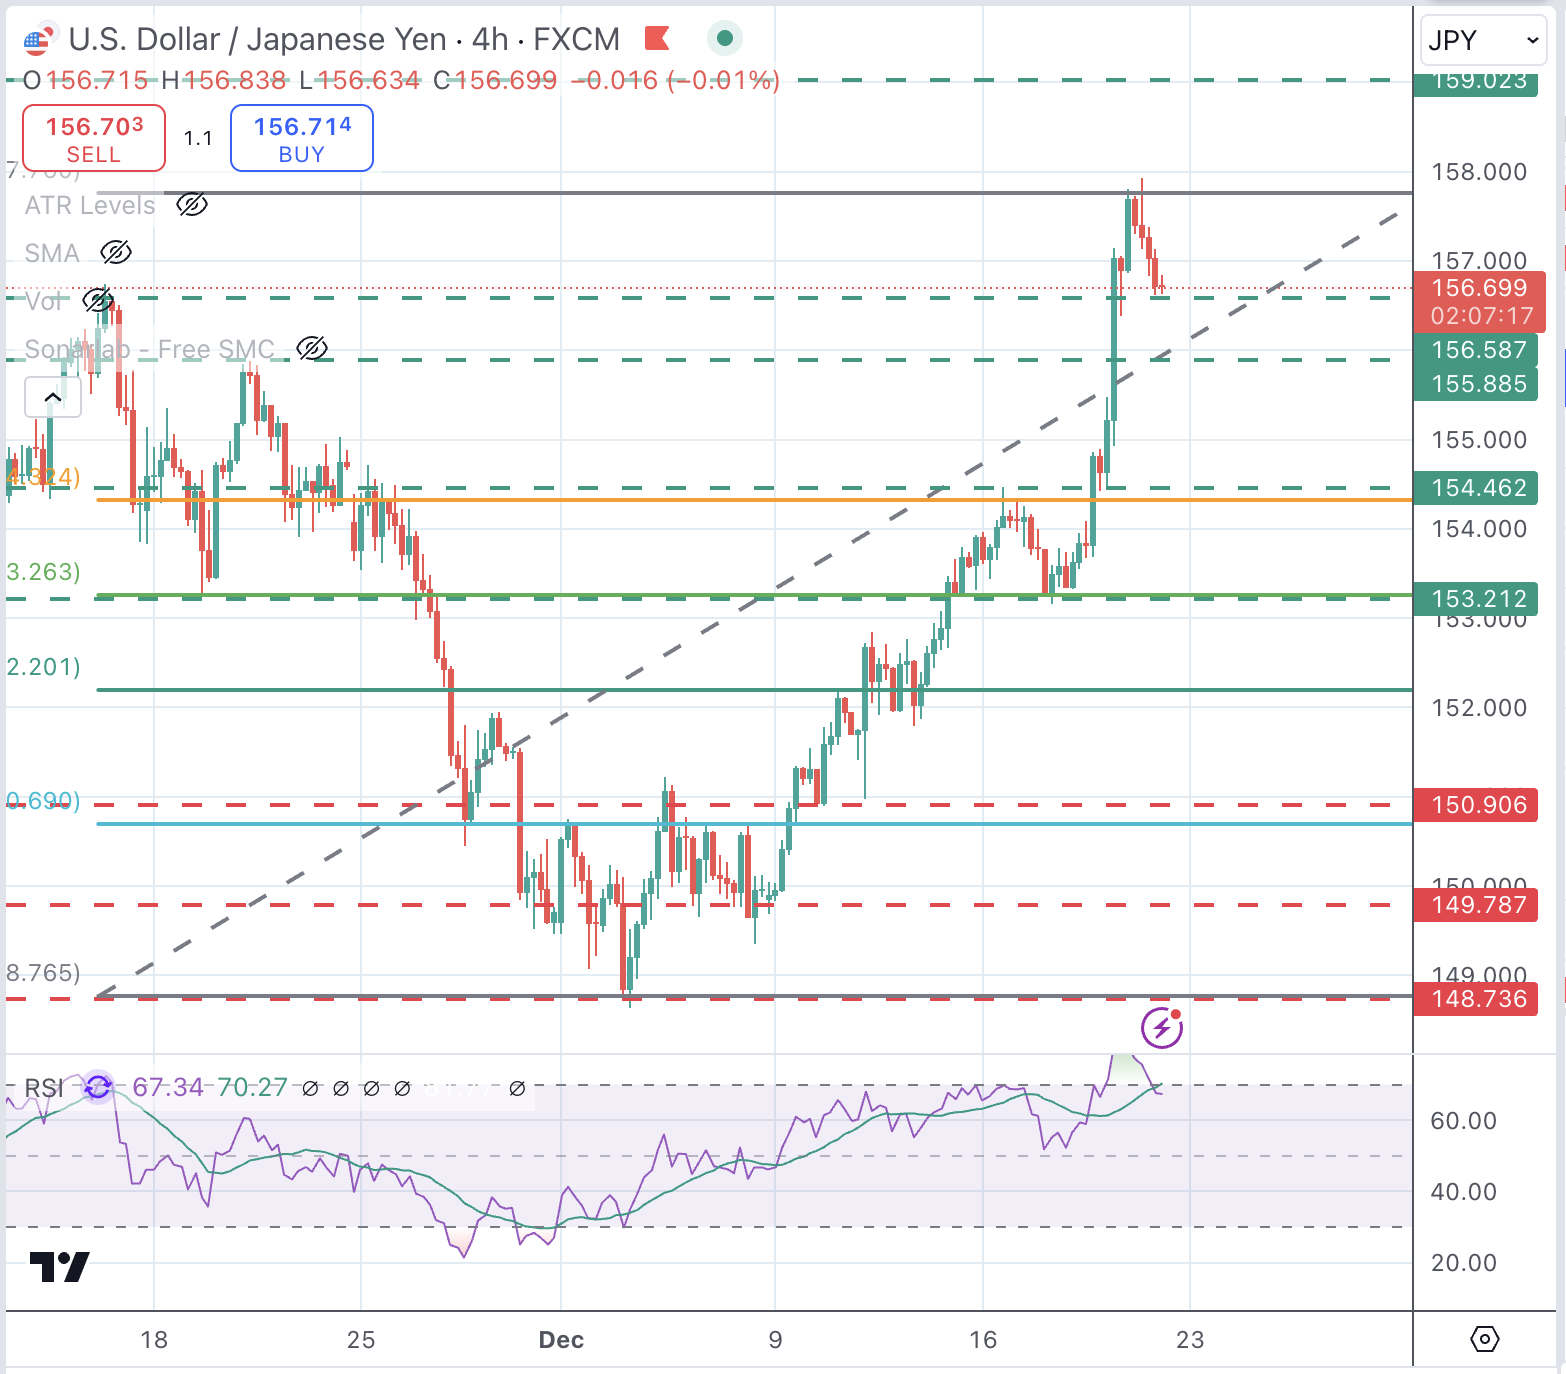
The USD/JPY is correcting lower, after rallying about 2.6% earlier this week, reaching overbought levels on most timeframes.
The broader trend, however, remains positive, with bears contained above the previous top, at 156.60 and the next support level at 155.85 ahead of 154.45. Resistances are 158.00 and 158.80.
USD/JPY 4-Hour Chart

Japanese Yen PRICE Today
The table below shows the percentage change of Japanese Yen (JPY) against listed major currencies today. Japanese Yen was the strongest against the Australian Dollar.
| USD | EUR | GBP | JPY | CAD | AUD | NZD | CHF | |
|---|---|---|---|---|---|---|---|---|
| USD | -0.24% | -0.02% | -0.39% | -0.03% | 0.22% | 0.08% | -0.48% | |
| EUR | 0.24% | 0.22% | -0.13% | 0.22% | 0.47% | 0.32% | -0.24% | |
| GBP | 0.02% | -0.22% | -0.35% | 0.00% | 0.22% | 0.10% | -0.45% | |
| JPY | 0.39% | 0.13% | 0.35% | 0.36% | 0.61% | 0.45% | -0.08% | |
| CAD | 0.03% | -0.22% | 0.00% | -0.36% | 0.25% | 0.11% | -0.44% | |
| AUD | -0.22% | -0.47% | -0.22% | -0.61% | -0.25% | -0.16% | -0.70% | |
| NZD | -0.08% | -0.32% | -0.10% | -0.45% | -0.11% | 0.16% | -0.54% | |
| CHF | 0.48% | 0.24% | 0.45% | 0.08% | 0.44% | 0.70% | 0.54% |
The heat map shows percentage changes of major currencies against each other. The base currency is picked from the left column, while the quote currency is picked from the top row. For example, if you pick the Japanese Yen from the left column and move along the horizontal line to the US Dollar, the percentage change displayed in the box will represent JPY (base)/USD (quote).
More By This Author:
USD/JPY Price Forecast: Bulls Pause For Breather Ahead Of US PCE Price IndexJapanese Yen Struggles To Capitalize On Modest Intraday Bounce; Remains Vulnerable
AUD/USD Picks Up From Lows Near 0.6200 As The US Dollar Gives Away Some Gains
Information on these pages contains forward-looking statements that involve risks and uncertainties. Markets and instruments profiled on this page are for informational purposes only and should not ...
more


