USD/JPY Analysis: Will We See Resistance At 150.00 Again?
- The USD/JPY currency pair has stabilized modestly in recent days as some traders continued to buy the dip.
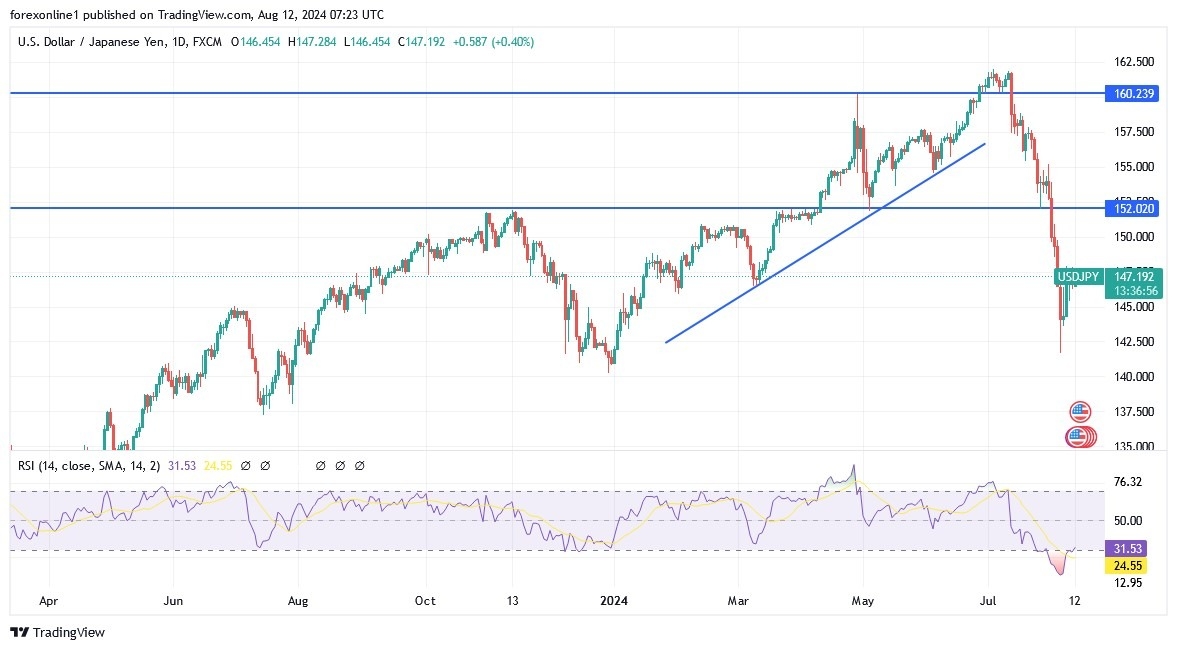
- According to reliable trading platforms, the dollar/yen reached its lowest level at 141.77 last Monday and pared some losses, moving to a high of 147.
- However, the pair remains well below its last month's high of 161.87.
(Click on image to enlarge)
Trading the Japanese Yen
The USD/JPY exchange rate has suffered a sharp reversal as investors focused on the actions of the Bank of Japan and the US Federal Reserve. For a long time, interest rates between the US and Japan were vastly divergent. Recently, US interest rates were 5.50% while in Japan they were at -0.10%. This gap created an exciting carry trade opportunity as many investors borrowed heavily to invest in other countries, especially the US. Now, the pendulum has swung, and the Bank of Japan has moved out of negative interest rates and raised interest rates to 25 basis points. It has done so in an attempt to combat inflation, which has remained above 2% for the past few months.
US Federal Reserve Rate Cuts
On the other hand, the US Federal Reserve has hinted that it will start cutting US interest rates, joining other central banks such as the Bank of England (BoE), the European Central Bank (ECB), and the Swiss National Bank (SNB). Overall, the chances of the US cutting interest rates have increased in recent weeks after the US released mixed economic data. According to the Bureau of Labor Statistics (BLS), inflation in the country has declined for the past three consecutive months. According to the economic calendar, the headline Consumer Price Index (CPI) rose to 3.0% while the Personal Consumption Expenditure (PCE) inflation figure fell to 2.5%. Meanwhile, these numbers are higher than the Fed's 2% target, they are moving in the right direction.
The Labor market, the other part of the Fed's dual mandate, is weakening, with the unemployment rate rising to 4.3%. Historically, the economy has entered a recession whenever the unemployment rate has risen for five consecutive months. Other economic figures related to Labor productivity, manufacturing output, and industrial production were also weaker than expected.
Therefore, the US Federal Reserve is in an unpredictable position. Failure to cut interest rates now could push the US economy into a deep recession. On the other hand, aggressively cutting interest rates would fuel inflation. Overall, analysts have mixed views on what to expect when the Fed meets in September and when Jerome Powell speaks at the Jackson Hole symposium. Some analysts expect the bank to deliver a hefty 0.50% hike at this meeting followed by smaller 0.25% cuts. On the other hand, other analysts believe that the cut should start at 0.25% to prevent inflation risks.
The Unwinding of the Yen Trade is Not Over
Therefore, the continuous rise of the USD/JPY pair has led some analysts to expect that the unwinding of the Japanese yen trade is over. However, we believe that this trade is still entrenched in the market and that it will take time and cause more damage for a while. Furthermore, the size of the Japanese yen trade remains unclear. Analysts at Deutsche Bank believe it could be worth over $20 trillion, a figure equal to about 505% of Japan's GDP and even larger than China's GDP. Ultimately, we believe this view is grossly exaggerated.
Taking a look at the Bank for International Settlements (BIS) data estimates the Japanese yen trade to be worth around $1 trillion while other figures suggest it is 3.4 trillion yen. These figures mean that the yen trade is huge, and it will take some time to unwind.
USD/JPY Technical Analysis and Expectations Today
The daily chart shows that the USD/JPY exchange rate peaked at 161.87 in July and has collapsed sharply in the past few weeks. Clearly, this decline occurred when the Bank of Japan started raising interest rates and intervening in the Forex market. According to the trades, the pair has fallen below the 50-day and 200-day EMAs, and the pair is about to make a bearish crossover. In most cases, this pattern is one of the most bearish patterns in the market.
After the sharp decline on Bloody Monday, the pair rebounded from 141 to 147. This rebound occurred after the pair formed a hammer candle, which is a sign of a bullish reversal.
The pair retested the 38.2% Fibonacci retracement point. At the same time, the Relative Strength Index (RSI) and Stochastic have indicated a rise and have exited the oversold level. Therefore, we believe that the USD/JPY pair is going through an unexpected rebound period and will resume the downtrend in the near term. If this happens, the next point to watch will be at 141.77, its low this week. A break below this level will take the pair to 140.
More By This Author:
Gold Analysis: Future Of The $2400 PeakGBP/USD Analysis: Selling Pressures Continue
EUR/USD Analysis: Short-Lived Gains
Disclosure: DailyForex will not be held liable for any loss or damage resulting from reliance on the information contained within this website including market news, analysis, trading signals ...
more


