


Image Source: Pixabay
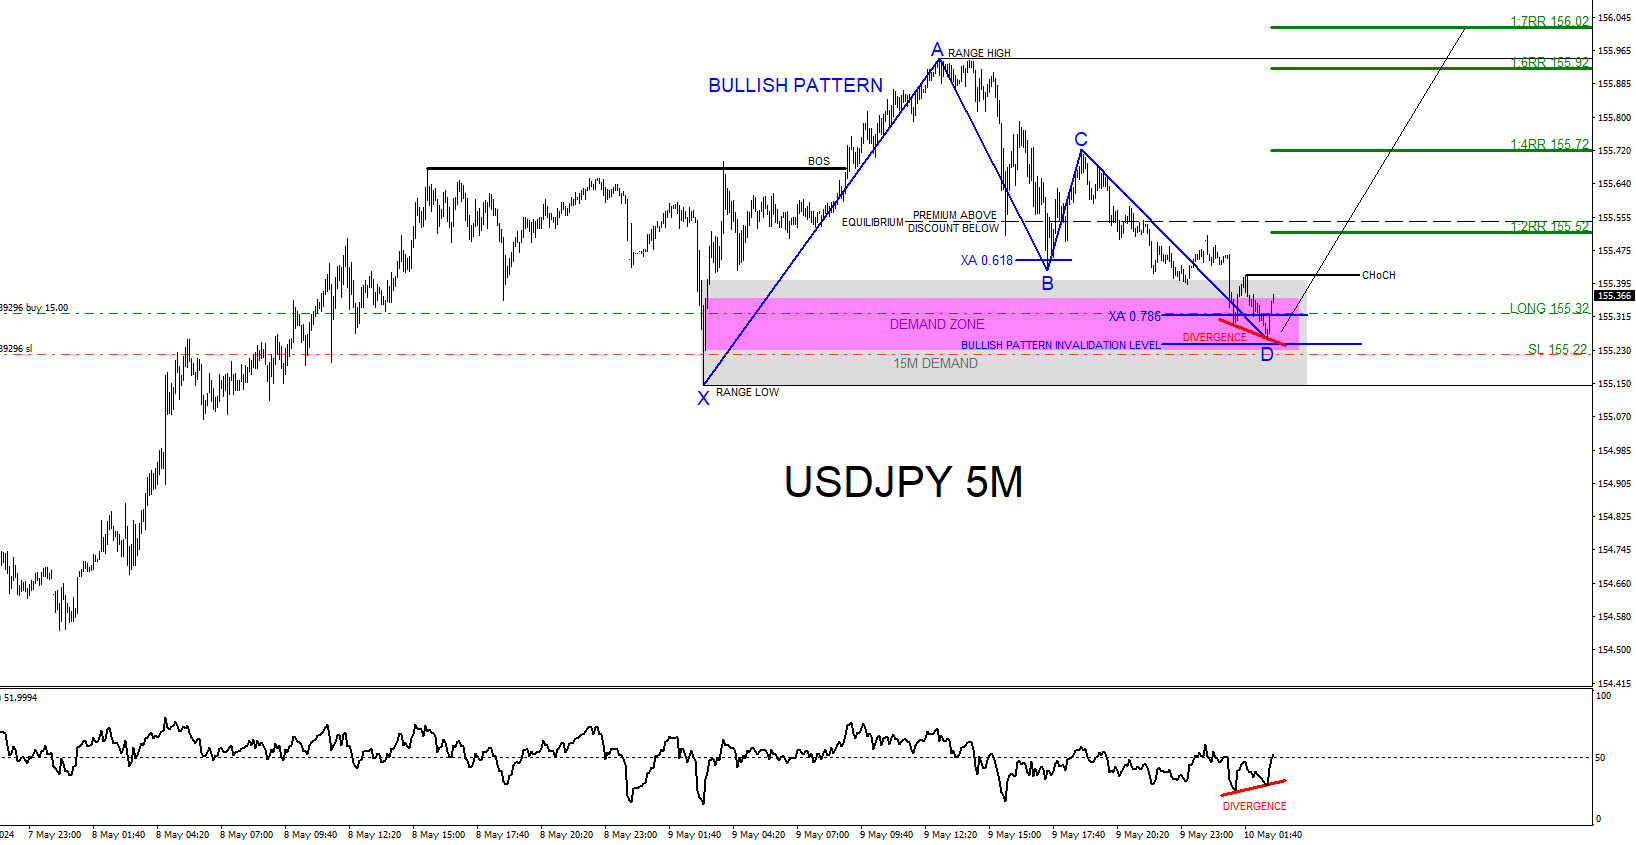
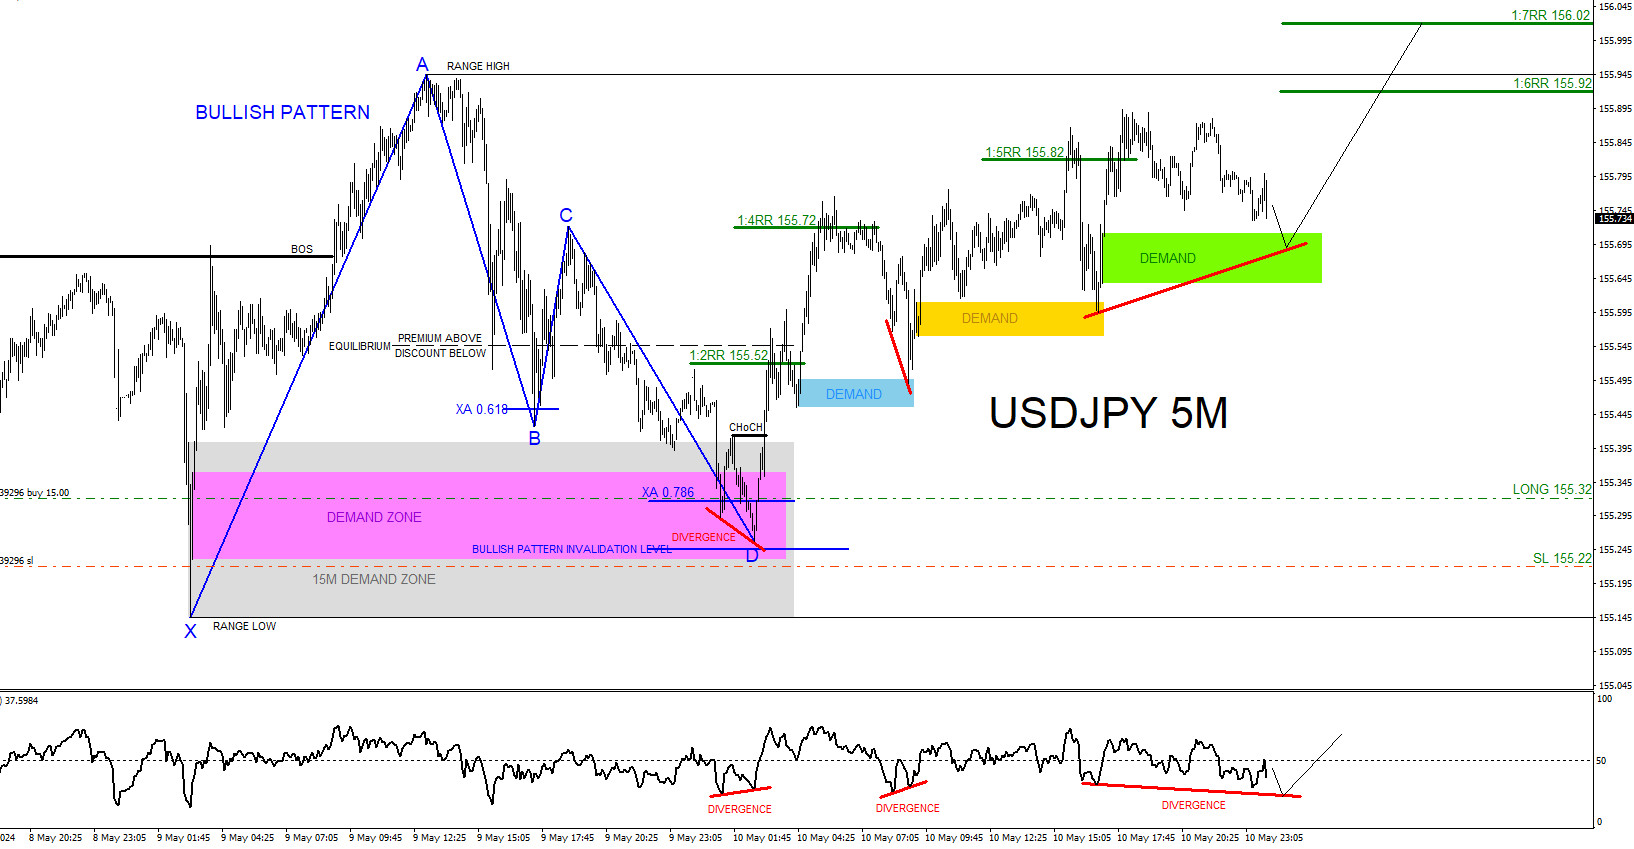
On May 9 and May 11, 2024, I posted on social media @AidanFX two USDJPY BUY setup charts. The pair formed bullish patterns (Blue & Red) in the demand/buy zone (Pink and 15M Gray) where the 1st buy entry (Green) was triggered.
USDJPY 5 Minute Chart May 9, 2024 (1st Entry <Green>)
USDJPY 5 Minute Chart May 11, 2024 (Posted the 2nd BUY set up during the weekend)
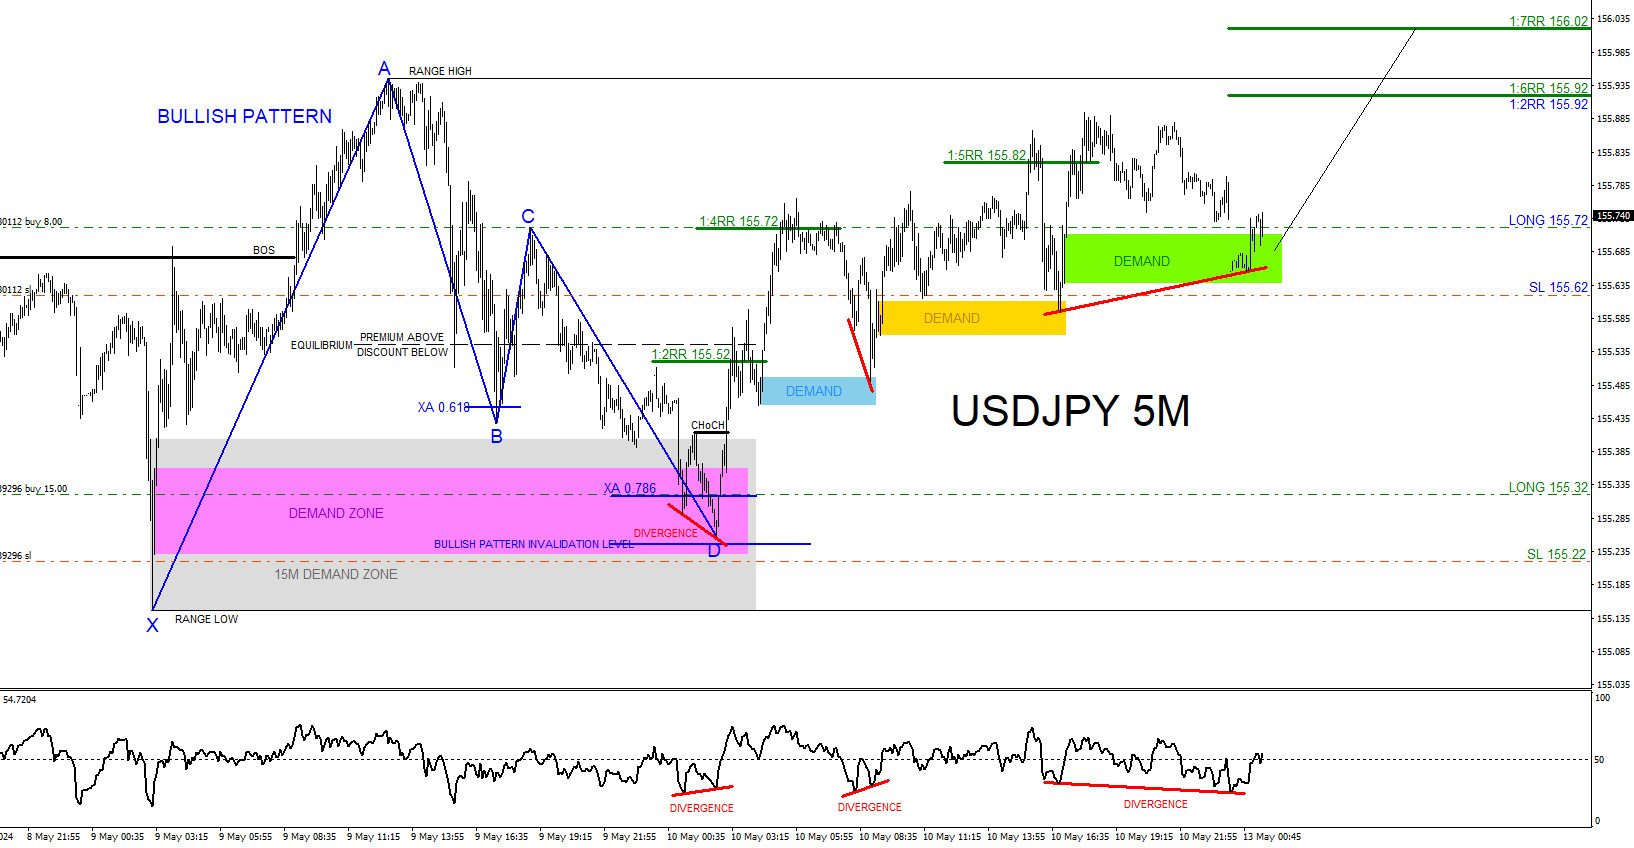
USDJPY 5 Minute Chart May 12, 2024 (2nd Entry <Blue>)
USDJPY 5 Minute Chart May 12, 2024 (Targets Hit)
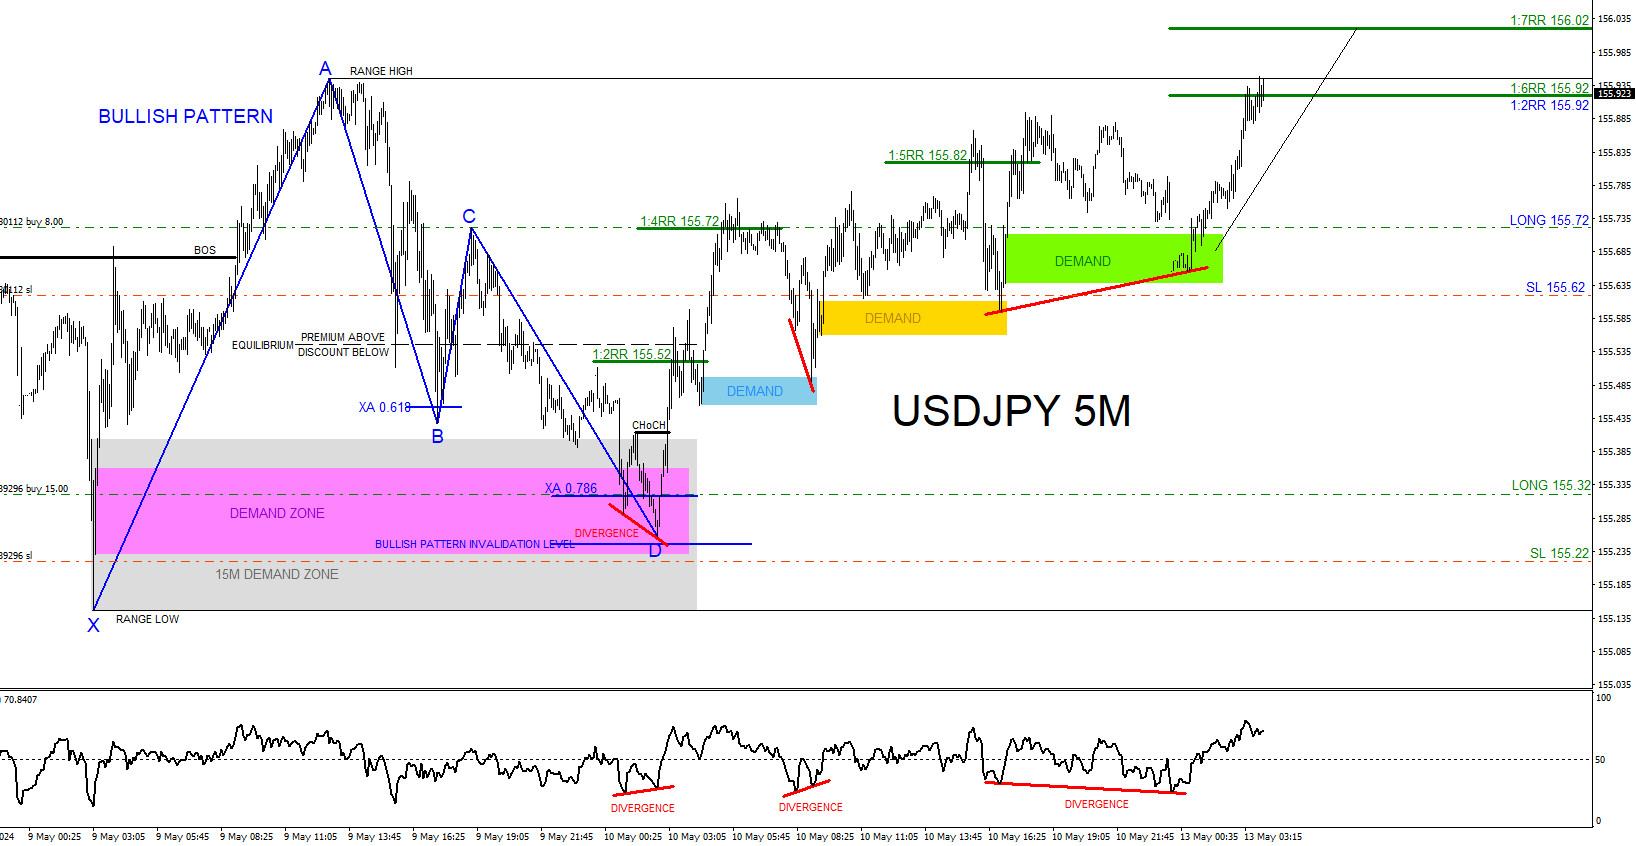
Entered the 1st BUY trade at 155.32 with a 10 pip stop loss at 155.22. Entered the 2nd BUY trade at 155.72 with a 10 pip stop loss at 155.62. On May 12 2024 USDJPY moves higher to the proposed targets. The 1st entry 1:6RR target at 155.92 and the 2nd entry target at the same 155.92 level hits and is where I closed both buy trades for a total of +80 pips +7% gain (Risked 1% on 1st BUY trade Green and risked 0.5% on 2nd BUY trade Blue).
A trader should always have multiple strategies all lined up before entering a trade. Never trade off one simple strategy. When multiple strategies all line up it allows a trader to see a clearer trade setup.
More By This Author:
Elliott Wave Expects AUDUSD To Break HigherElliott Wave Analysis On USDJPY Recovery Post BOJ Intervention
COST Favors Rally To Continue In Bullish Sequence



Comments
Log in or sign up to join the conversation.