
(Click on image to enlarge)
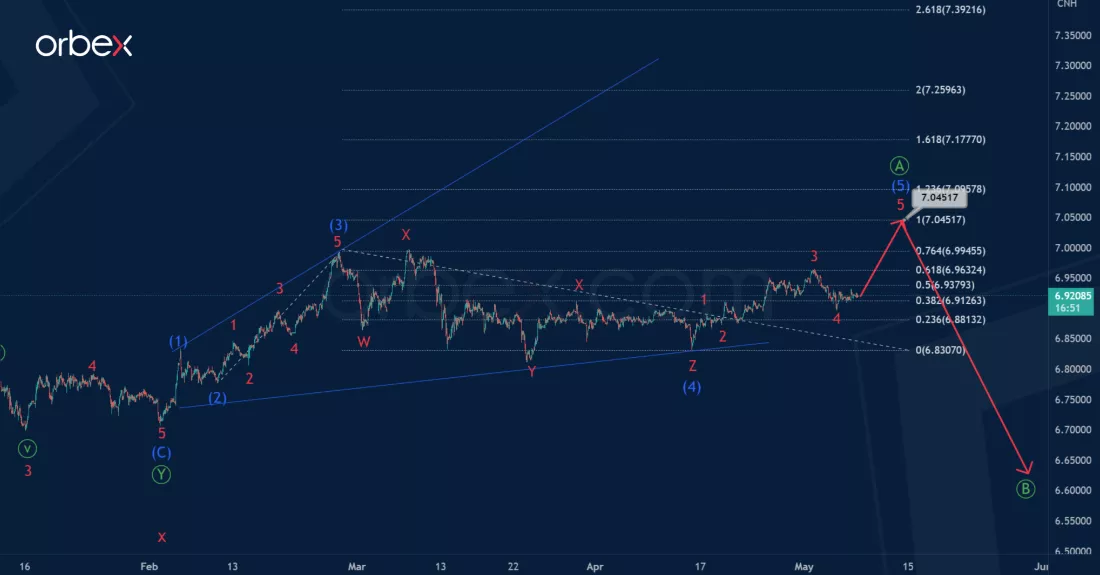
The USDCNH currency chart shows the formation of a double zigzag w-x-y of the cycle degree.
In the last section of the chart, the initial part of the actionary wave y can be constructed. It seems that it will take the form of a standard zigzag Ⓐ-Ⓑ-Ⓒ.
The first wave Ⓐ, which has the form of a leading diagonal is under development.
The price in the last intermediate wave (5) could rise to 7.045. At that level, wave (5) will be at 100% of impulse (3).
(Click on image to enlarge)
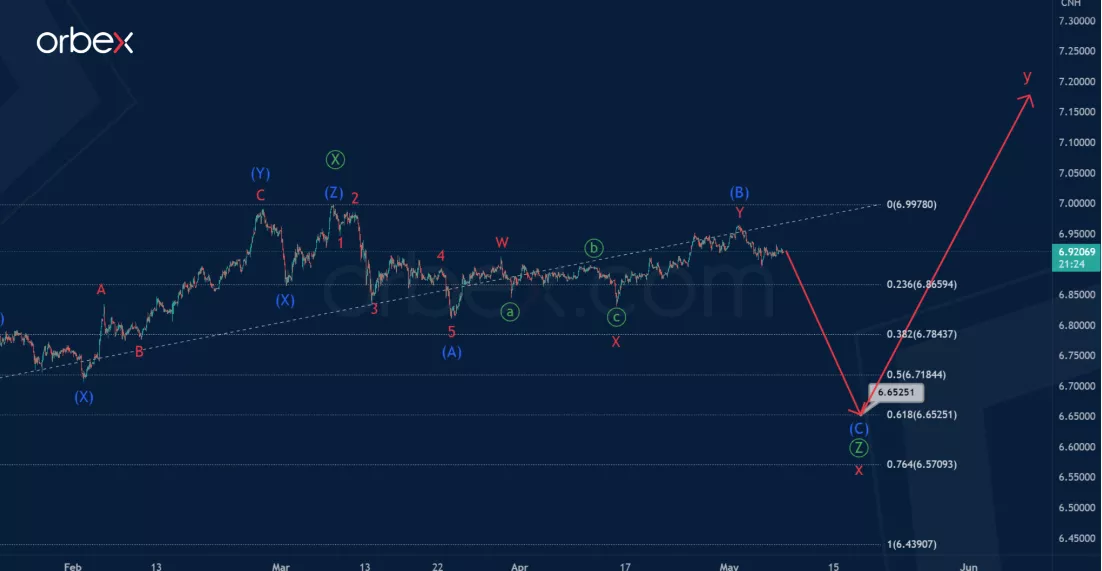
Alternatively, the construction of the cycle intervening wave x is still in progress. It can take the form of a triple zigzag Ⓦ-Ⓧ-Ⓨ-Ⓧ-Ⓩ.
The primary intervening wave Ⓧ, which has the form of an intermediate triple zigzag (W)-(X)-(Y)-(X)-(Z), has ended.
Probably the final wave Ⓩ will take the form of a standard zigzag, as shown in the chart. Its end is expected near 6.652, where it will be at 61.8% of wave Ⓨ.
More By This Author:
ECB Expected To Hike At Least 25bps
USDCHF: Ending Diagonal Nears Completion
Intraday Analysis – USD Struggles To Bounce


Comments
Log in or sign up to join the conversation.