USD/CHF Price Analysis: Trades Back And Forth Around 0.8800
- USD/CHF trades sideways near 0.8800 as the focus shifts to US economic data.
- The Swiss economy is expected to have growth at a moderate pace of 0.1% in the last quarter of 2023.
- Fed policymakers support holding interest rates unchanged in the range of 5.25%-5.50%.
The USD/CHF is stuck in a tight range near the round-level resistance of 0.8800 since Friday’s trading session. The Swiss Franc asset struggles to find a direction as investors await the United States core Personal Consumption Expenditure price index (PCE) and Swiss Q4 Gross Domestic Product (GDP) data for further guidance.
The US Dollar edges down in Tuesday’s trading session. Further action in the US Dollar will be guided by the US core PCE price index data, which will influence market expectations for the Federal Reserve’s (Fed) rate cuts.
Meanwhile, Fed policymakers argue in favor of holding interest rates unchanged in the range of 5.25%-5.50% until they get evidence that inflation will fall sustainably to the required rate of 2%.
On the Swiss front, investors await the Q4 GDP data, which will be published on Thursday. Investors anticipate the economy grew modestly by 0.1% in the October-December quarter against 0.3% in the third quarter of 2023.
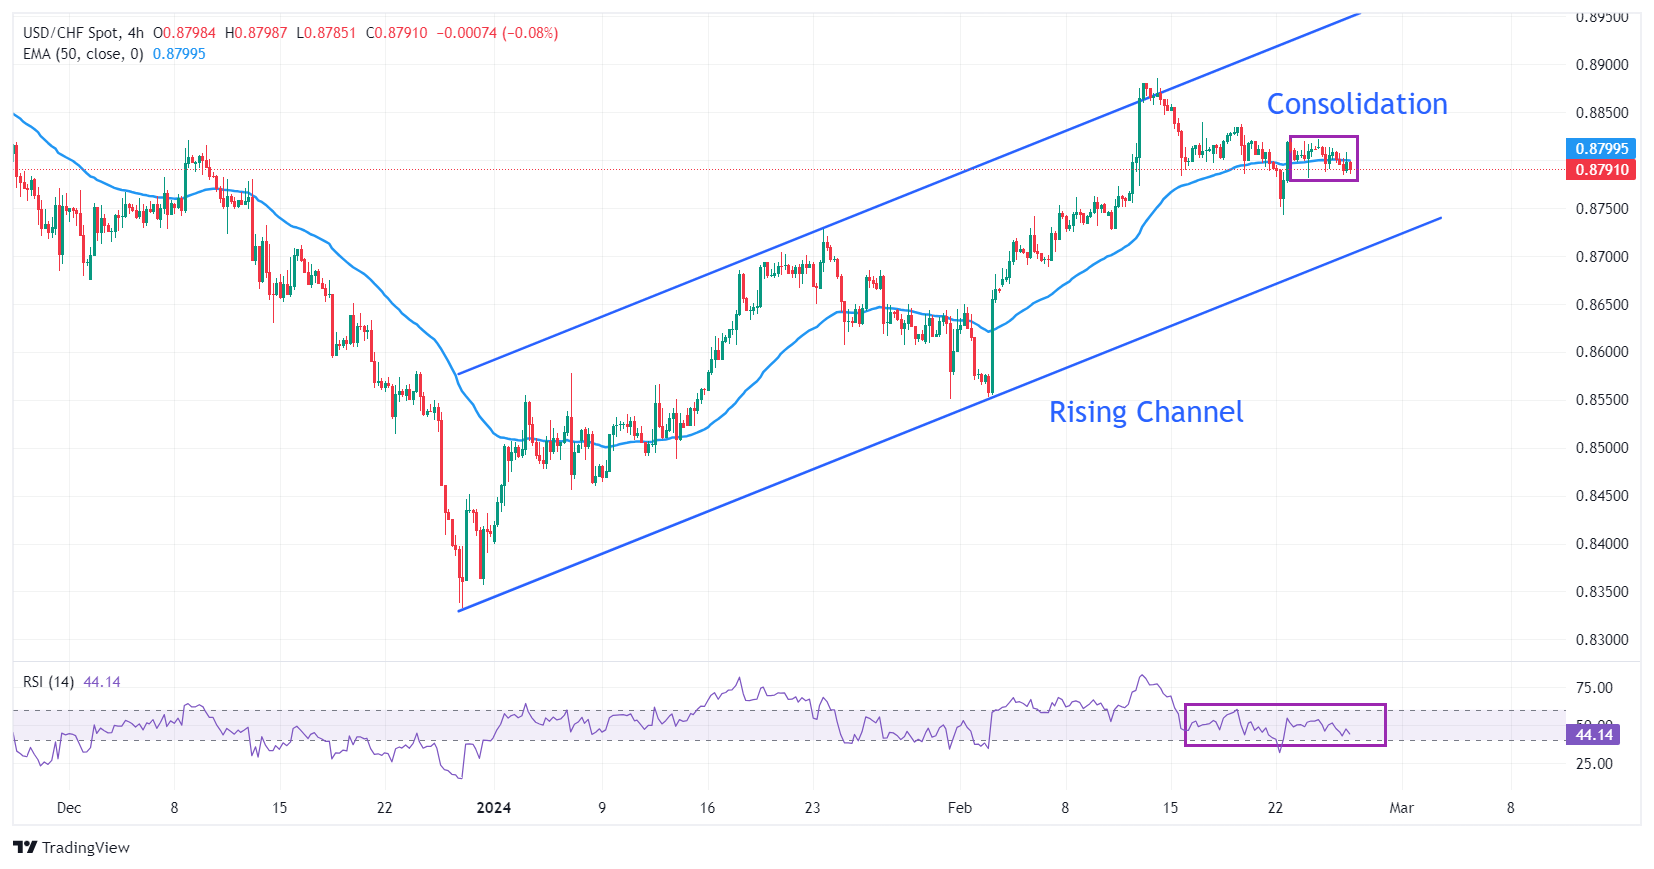
USD/CHF consolidates in a narrow range around 0.8800. The broader outlook remains bullish as the pair trades in a Rising Channel chart pattern formed on a four-hour timeframe. In the aforementioned chart pattern, market participants consider each pullback a buying opportunity.
The 50-period Exponential Moving Average (EMA) at 0.8800 remains sticky with spot prices, indicating a sideways trend.
The 14-period Relative Strength Index (RSI) oscillates in the 40.00-60.00 range, demonstrating a sharp volatility contraction.
Fresh upside would emerge if the asset breaks above the three-month high of around 0.8886, which would unlock upside towards the September 20 low at 0.8932 and the November 8 low at 0.8976.
On the contrary, a breakdown below February 13 low at 0.8746 would expose the asset to round-level support of 0.8700, followed by February 1 high around 0.8650.
USD/CHF four-hour chart
(Click on image to enlarge)
USD/CHF
| OVERVIEW | |
|---|---|
| Today last price | 0.879 |
| Today Daily Change | -0.0011 |
| Today Daily Change % | -0.12 |
| Today daily open | 0.8801 |
| TRENDS | |
|---|---|
| Daily SMA20 | 0.8753 |
| Daily SMA50 | 0.8638 |
| Daily SMA100 | 0.8766 |
| Daily SMA200 | 0.8836 |
| LEVELS | |
|---|---|
| Previous Daily High | 0.8822 |
| Previous Daily Low | 0.8788 |
| Previous Weekly High | 0.8838 |
| Previous Weekly Low | 0.8742 |
| Previous Monthly High | 0.8728 |
| Previous Monthly Low | 0.8399 |
| Daily Fibonacci 38.2% | 0.8801 |
| Daily Fibonacci 61.8% | 0.8809 |
| Daily Pivot Point S1 | 0.8785 |
| Daily Pivot Point S2 | 0.877 |
| Daily Pivot Point S3 | 0.8751 |
| Daily Pivot Point R1 | 0.882 |
| Daily Pivot Point R2 | 0.8838 |
| Daily Pivot Point R3 | 0.8854 |
More By This Author:
EUR/USD Trades With Modest Gains Above Mid -1.0800s Amid Modest USD DowntickGBP/JPY Continues To Climb Into Multi-Year Highs, Approaches 191.50
US Dollar Trades Lower Following Soft Housing Data
Disclosure: Information on this article contains forward-looking statements that involve risks and uncertainties. Markets and instruments profiled on this page are for informational purposes ...
more


