
- USD/CHF advances to 0.8860 as higher US core PCE inflation data strengthens US Dollar.
- The Swiss Franc remains on the back foot as the SNB is expected to lead the global rate-cut cycle.
- Investors await the US Manufacturing PMI for fresh insights on the economic outlook.
The USD/CHF pair extends its upside to 0.8860 in Friday’s European session. The Swiss Franc asset strengthens due to firm US Dollar and hopes that the Swiss National Bank (SNB) will lead the rate-cut cycle.
The US Dollar Index (DXY), which gauges Greenback’s value against six major currencies, has turned sideways around 104.20 after a sharp recovery from 103.70.
The appeal for the US Dollar improves due to higher United States monthly core Personal Consumption Expenditure Price Index (PCE) data for January, indicating that the Federal Reserve’s (Fed) path to 2% inflation would be bumpy. The monthly core inflation grew by 0.4% as expected, higher than the 0.2% pace necessary to achieve price stability.
Meanwhile, cooling price pressures in the Swiss economy have prompted a chance of rate cuts by the SNB in March. In January, inflation fell to 1.3% against expectations of 1.7%, allowing the SNB to pivot to a dovish monetary policy stance.
In today’s session, market participants will focus on the US ISM Manufacturing PMI for February, which will be published at 15:00 GMT. Investors anticipate factory data to come at 49.5, higher than 49.1 in January but will remain below the 50.0 threshold.
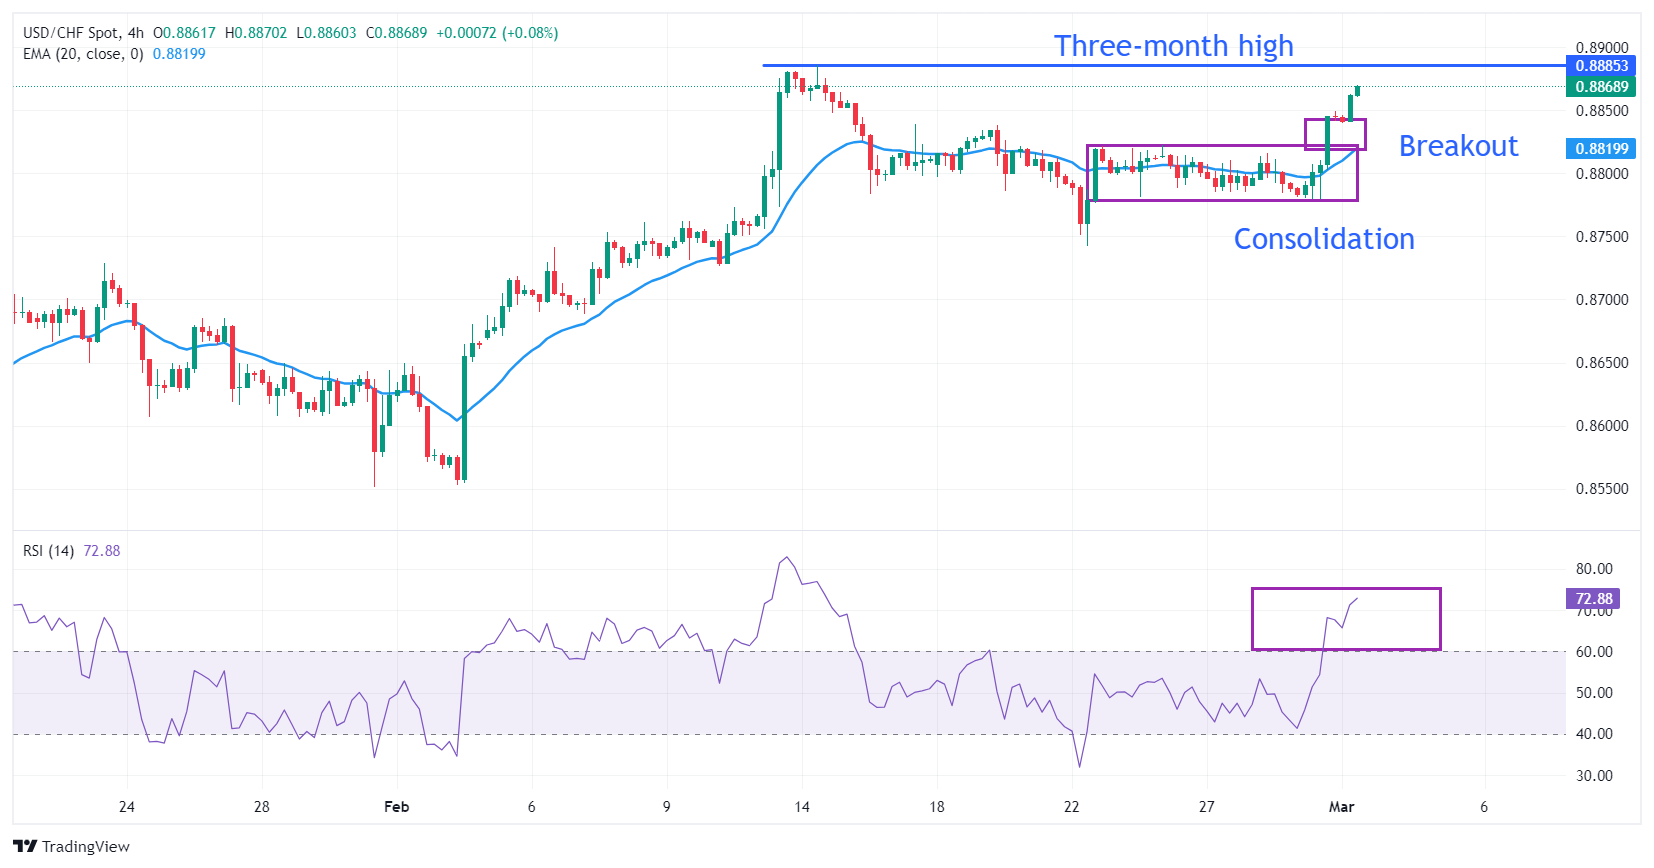
USD/CHF delivers a vertical upside move after a breakout of the consolidation formed between the 0.8778-0.8824 range in a four-hour timeframe. The consolidation formation indicates a sharp contraction in volatility, which exhibits narrow ticks and low volume. A breakout of the same results in a volatility expansion, followed by wider ticks and heavy volume.
The near-term outlook is bullish as the 20-period Exponential Moving Average (EMA) at 0.8821 is sloping higher.
The 14-period Relative Strength Index (RSI) shifts into the bullish range of 60.00-80.00, indicating a positive momentum has been triggered.
Fresh upside would emerge if the asset breaks above the three-month high around 0.8886, which would unlock upside towards September 20 low at 0.8932 and November 8 low at 0.8976.
On the contrary, a breakdown below February 13 low at 0.8746 would expose the asset to the round-level support of 0.8700, followed by February 1 high around 0.8650.
USD/CHF four-hour chart
(Click on image to enlarge)
USD/CHF
| OVERVIEW | |
|---|---|
| Today last price | 0.8868 |
| Today Daily Change | 0.0026 |
| Today Daily Change % | 0.29 |
| Today daily open | 0.8842 |
| TRENDS | |
|---|---|
| Daily SMA20 | 0.8783 |
| Daily SMA50 | 0.8651 |
| Daily SMA100 | 0.8759 |
| Daily SMA200 | 0.8833 |
| LEVELS | |
|---|---|
| Previous Daily High | 0.8846 |
| Previous Daily Low | 0.8779 |
| Previous Weekly High | 0.8838 |
| Previous Weekly Low | 0.8742 |
| Previous Monthly High | 0.8886 |
| Previous Monthly Low | 0.8553 |
| Daily Fibonacci 38.2% | 0.882 |
| Daily Fibonacci 61.8% | 0.8805 |
| Daily Pivot Point S1 | 0.8799 |
| Daily Pivot Point S2 | 0.8756 |
| Daily Pivot Point S3 | 0.8733 |
| Daily Pivot Point R1 | 0.8866 |
| Daily Pivot Point R2 | 0.8889 |
| Daily Pivot Point R3 | 0.8932 |
More By FX Street:
USD/CAD Depreciates To Near 1.3560 On Higher Crude Oil Prices, US Manufacturing PMI Eyed
AUD/USD Holds Steady Below 0.6500 Amid Mixed Market Signals
USD/JPY Price Analysis: Dives Below 150.00 Amid BoJ Member’s Hawkish Comments


Comments
Log in or sign up to join the conversation.