
Photo by Claudio Schwarz on Unsplash
- USD/CHF gains momentum, signaling a possible bullish trend in coming sessions.
- Double bottom in the 4-hour chart could pave the USD/CHF way to 0.9300.
- USD/CHF Price Analysis: Daily close above 0.9220 would confirm the double bottom.
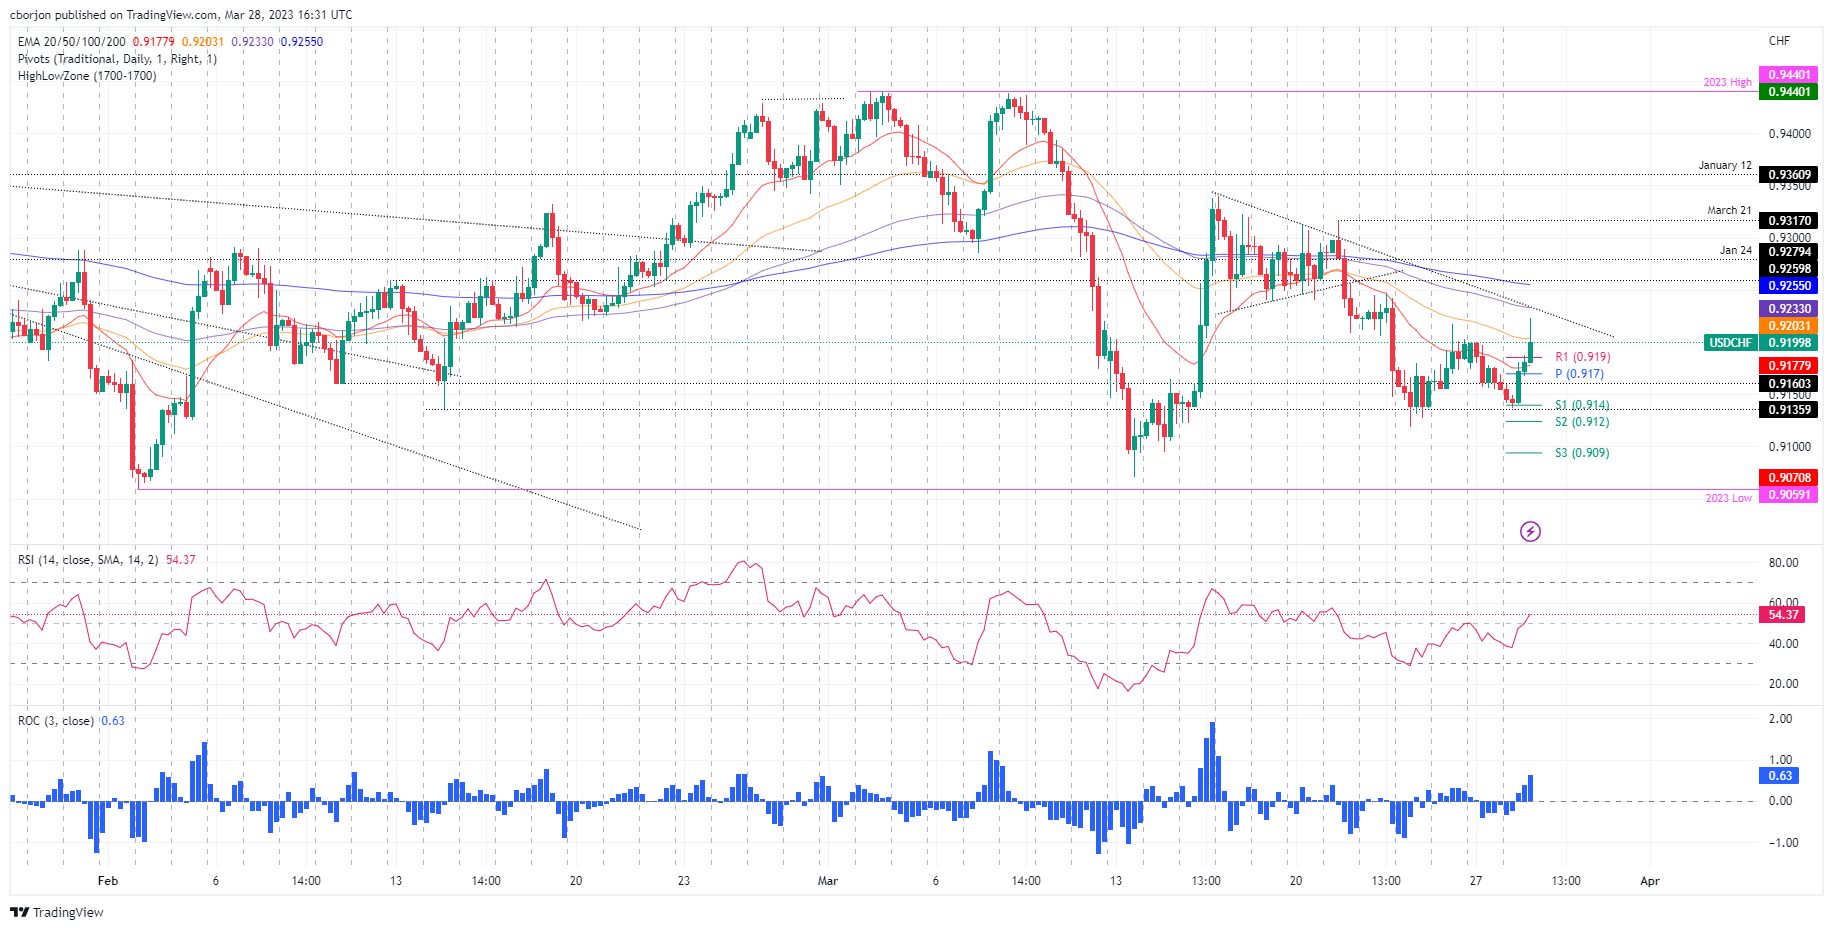
The USD/CHF bounces off weekly lows of 0.9136 and climbs toward testing 0.9200 in the North American session. After hitting a daily high of 0.9226, the USD/CHF is trading at 0.9199, above its opening price.
USD/CHF Price action
Early, the USD/CHF tested last week’s low of 0.9118; since then, it has not looked back. However, as long as the USD/CHF pair achieves a daily close below 0.9200, that would keep the major trading sideways, awaiting a fresh catalyst. On the other hand, the USD/CHF could resume upwards, and it might test the 20 and 50-day EMAs, each at 0.9240 and 0.9272, respectively. Upside risks lie at 0.9300, followed by the 100-day EMA at 0.9343.
Short term, the USD/CHF 4-hour chart portrays a double bottom formed. However, the exchange rate must clear the March 24 high at 0.9216 to confirm its validity. That would pave the way toward the March 21 high of 0.9317, but the pair needs to hurdle some resistance levels on its way north.
The USD/CHF first resistance would be 0.9216. A breach of the latter wand the USD/CHF will face the 100-EMA at 0.9233, followed by the 200-EMA at 0.9255. Once broken, the 0.9300 figure would be up for grabs.
USD/CHF 4-hour chart
(Click on image to enlarge)
USD/CHF Technical levels
USD/CHF
| OVERVIEW | |
|---|---|
| Today last price | 0.92 |
| Today Daily Change | 0.0044 |
| Today Daily Change % | 0.48 |
| Today daily open | 0.9156 |
| TRENDS | |
|---|---|
| Daily SMA20 | 0.9283 |
| Daily SMA50 | 0.9252 |
| Daily SMA100 | 0.9319 |
| Daily SMA200 | 0.9528 |
| LEVELS | |
|---|---|
| Previous Daily High | 0.92 |
| Previous Daily Low | 0.9154 |
| Previous Weekly High | 0.9317 |
| Previous Weekly Low | 0.912 |
| Previous Monthly High | 0.9429 |
| Previous Monthly Low | 0.9059 |
| Daily Fibonacci 38.2% | 0.9172 |
| Daily Fibonacci 61.8% | 0.9182 |
| Daily Pivot Point S1 | 0.914 |
| Daily Pivot Point S2 | 0.9124 |
| Daily Pivot Point S3 | 0.9095 |
| Daily Pivot Point R1 | 0.9186 |
| Daily Pivot Point R2 | 0.9216 |
| Daily Pivot Point R3 | 0.9231 |
More By This Author:
NZD/USD Leans Bearish In Phase Of ConsolidationWTI Soars Above $70.00 On Positive Sentiment And Geopolitical Tensions
AUD/USD Price Analysis: Bears Ready To Pounce


Comments
Log in or sign up to join the conversation.