
- USD/CHF bounces around the last week’s lows around 0.9310s.
- Near term, the USD/CHF formed a double bottom, which targets a rally towards 0.9430s.
The USD/CHF bounces from last week’s lows around 0.9313 and rises toward 0.9350s, due to a slight jump in US Dollar (USD) demand, amidst an optimistic market sentiment. Elevated US Treasury yields and market-moving economic data from the US due Tuesday bolstered the USD. At the time of writing, the USD/CHF is trading at 0.9378, above its opening price.
USD/CHF Price Analysis: Technical outlook
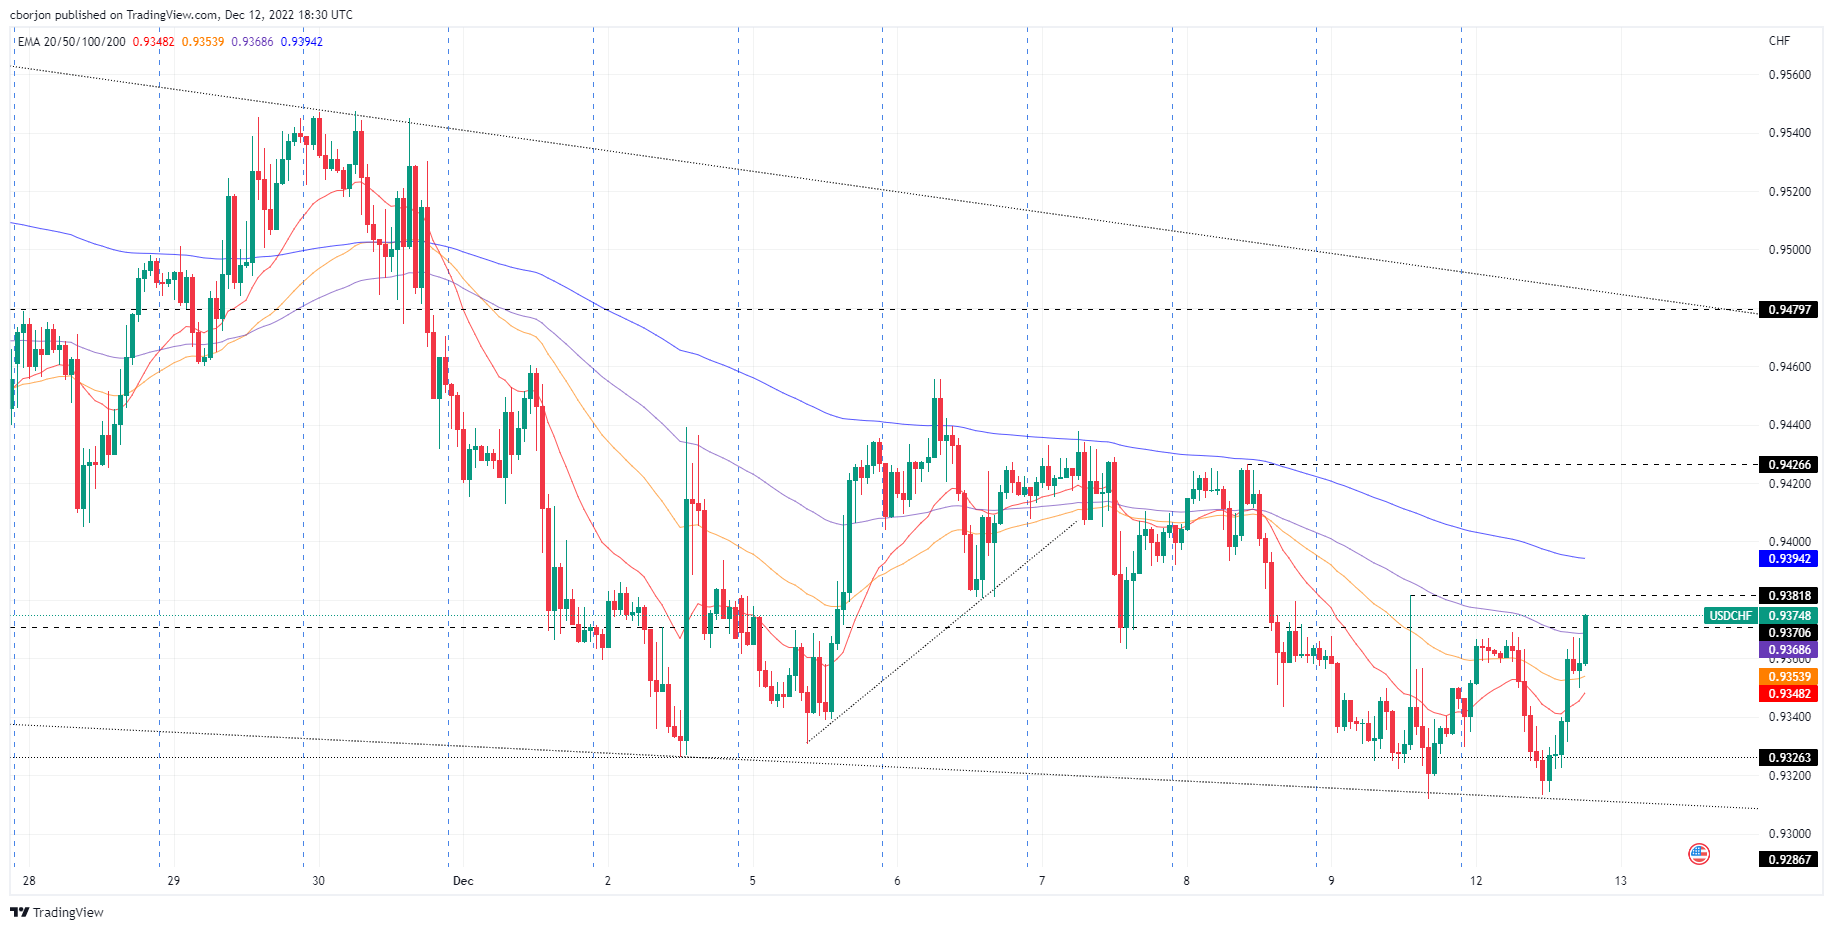
With the USD/CHF climbing in the North American session after bottoming at the falling-wedge bottom trendline, the USD/CHF remains neutral to downward biased. Nevertheless, a clear break above last Friday’s high of 0.9381 could pave the way to challenge the 0.9400 figure. The Relative Strength Index (RSI0 at bearish territory suggests sellers remain in charge; whatsoever the Rate of Change (RoC) indicates, they are losing momentum.
Short term, the USD/CHF formed a double bottom in the one-hour chart, which would be confirmed by a decisive break above 0.9381. Once achieved, the USD/CHF following resistance would be 0.9400, followed by the December 8 daily high of 0.9426, ahead of 0.9455. On the flip side, the USD/CHF first support would be the 100-Exponential Moving Average (EMA) at 0.9368. A breach of the latter will expose the 50-EMA at 0.9353, followed by the 20-EMA at 0.9347.
(Click on image to enlarge)
USD/CHF Key Technical Levels
USD/CHF
| OVERVIEW | |
|---|---|
| Today last price | 0.9378 |
| Today Daily Change | 0.0018 |
| Today Daily Change % | 0.19 |
| Today daily open | 0.935 |
| TRENDS | |
|---|---|
| Daily SMA20 | 0.945 |
| Daily SMA50 | 0.9737 |
| Daily SMA100 | 0.9692 |
| Daily SMA200 | 0.9647 |
| LEVELS | |
|---|---|
| Previous Daily High | 0.9382 |
| Previous Daily Low | 0.9312 |
| Previous Weekly High | 0.9456 |
| Previous Weekly Low | 0.9312 |
| Previous Monthly High | 1.0148 |
| Previous Monthly Low | 0.9357 |
| Daily Fibonacci 38.2% | 0.9339 |
| Daily Fibonacci 61.8% | 0.9355 |
| Daily Pivot Point S1 | 0.9314 |
| Daily Pivot Point S2 | 0.9278 |
| Daily Pivot Point S3 | 0.9244 |
| Daily Pivot Point R1 | 0.9384 |
| Daily Pivot Point R2 | 0.9418 |
| Daily Pivot Point R3 | 0.9454 |
More By This Author:
GBP/USD Price Analysis: Mean reversion To Near 20-EMA Around 1.2050 Looks LikelyS&P 500 Futures, Us Treasury Bond Yields Portray Market Fears, Focus On Recession, Fed
EUR/USD Price Analysis: Bulls Eye A Break Of Key 1.0550 Area, Eyes On 1.0600


Comments
Log in or sign up to join the conversation.