USD/CAD Signal: US Dollar Looks Stretched Against Loonie
Potential Signal
- I am a buyer of this pair if we just simply break higher.
- On a daily close above the 1.3850 level, this is a market that will go looking to the 1.40 level, and I would have my stop loss at the 1.3775 level.
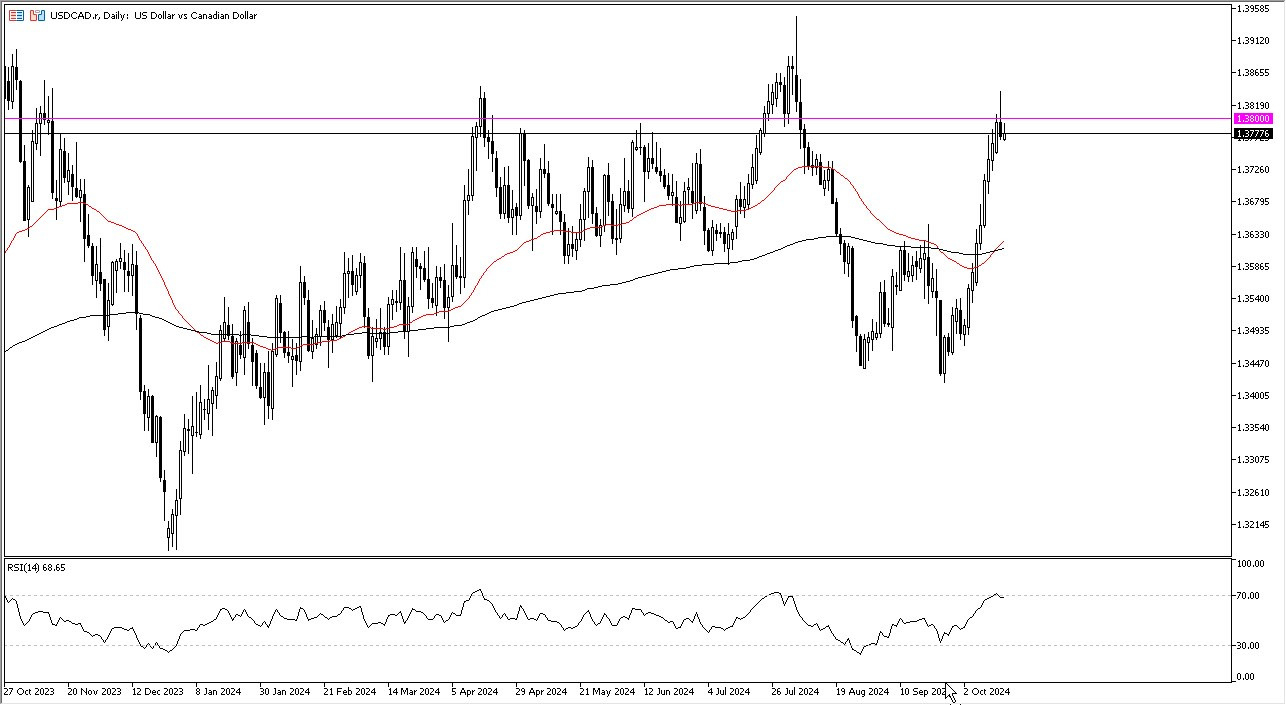
The US dollar has pulled back a little bit during the trading session from the highs as the 1.38 level continues to offer a significant amount of resistance. This is an area that's been important multiple times in the past, but quite frankly, I think the most obvious thing on the chart is that we are just overstretched at this point. We did end up forming a massive shooting star during the day on Tuesday at this crucial level and now, as we try to recover, it looks like we're going to give back some of those gains. This makes perfect sense, and it could be a short-term selling opportunity, but the reality is that there is a lot of momentum behind the US dollar.
So, I think what this ultimately ends up being is a short-term pullback that a lot of people will look for a bounce to take advantage of. Keep in mind that both of these currencies are somewhat interdependent in the sense that the United States and Canada share one of the largest borders in the world. And of course, a very tight trade route between the two countries.
(Click on image to enlarge)
Central Banks
The Bank of Canada has cut rates several times and the Federal Reserve cut rates 50 basis points recently, so there are a lot of questions as to whether or not there is going to be momentum in Canada because if the United States starts to slip, there goes Canada's biggest customer. If the US economy starts to worsen, that will ironically send this pair higher, just as continues to struggle and recently has had a couple of very anemic numbers. While I do think that eventually we probably break out to the upside, the question is going to be for what reason? While it may not matter here, it will certainly matter in multiple other markets. The 50-day EMA just crossed above the 200-day EMA down near the 1.36 level, so I think that's a hard floor and is the beginning of the so-called Golden Cross. A couple of days of negativity and a bounce could end up being a nice buying opportunity.
More By This Author:
GBP/USD Forecast: British Pound Continues To Watch A Major LevelUSD/JPY Forecast: Pullback After Hitting Resistance
Gold Forecast: Continues To Look Very Strong
Disclosure: DailyForex will not be held liable for any loss or damage resulting from reliance on the information contained within this website including market news, analysis, trading signals ...
more


