
- The US Dollar appreciates for the fourth day in a row against a vulnerable CAD.
- The Loonie struggles with WTI Oil prices, attempting to extend losses below $63.00.
- The pair might find resistance at a previous support area ahead of 1.3825.
The US Dollar is trading higher for the fourth consecutive day against the Canadian Dollar. The Greenback has shrugged off the pressure from the weak employment figures seen on Wednesday and is testing weekly highs above 1.3815, where it might find significant resistance.
The fundamental background is moderately favourable. Investors remain cautious of selling US Dollars ahead of Friday’s all-important Non-farm Payrolls report, while the Canadian Dollar keeps bleeding with Oil prices attempting to break below the $63.00 level.
Technical Analysis: A previous support might challenge US Dollar bulls
(Click on image to enlarge)
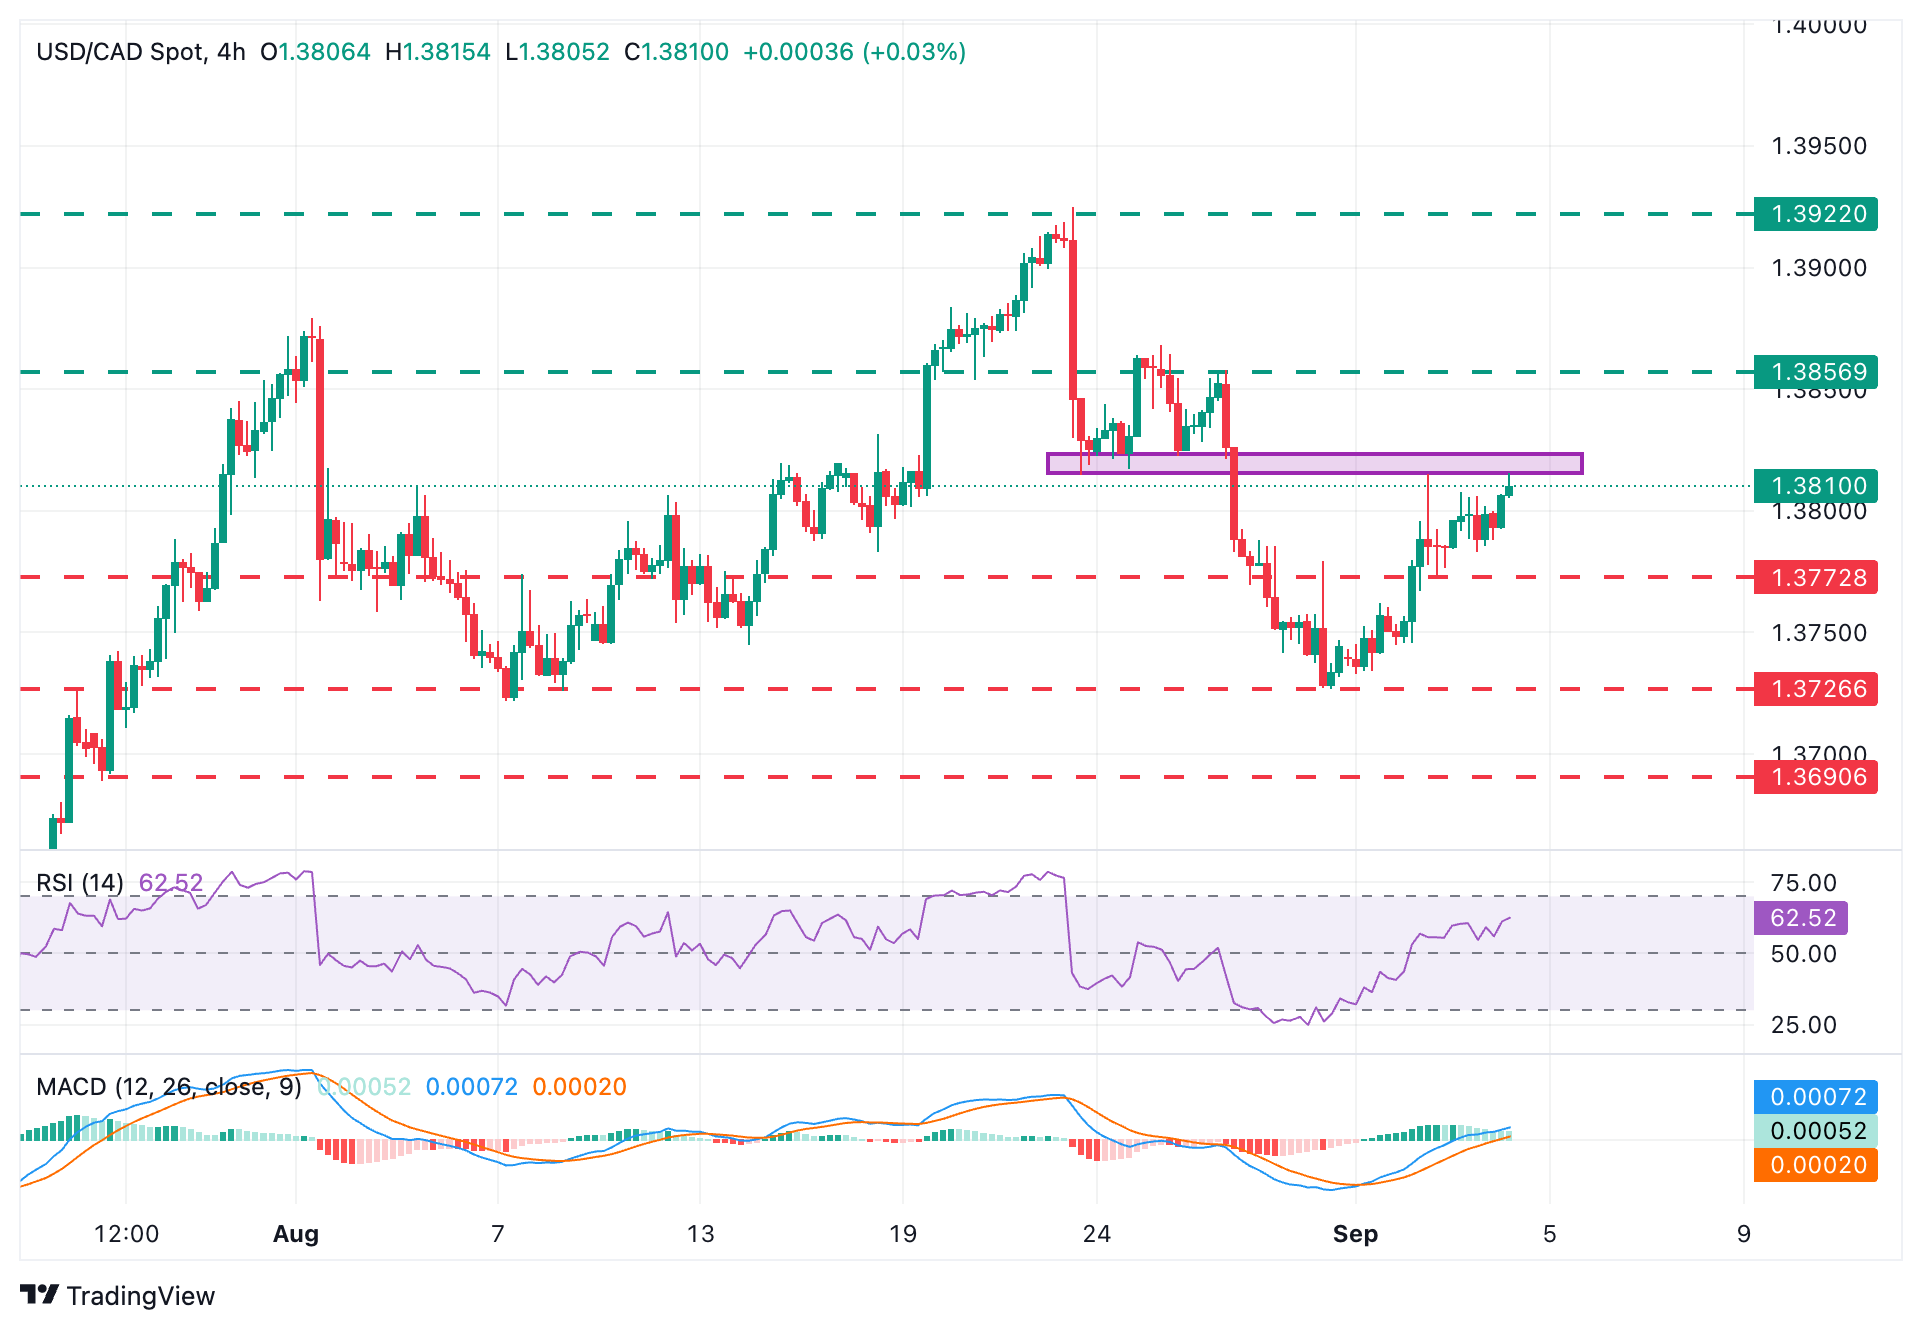
The technical picture is bullish. The 4-Hour RSI is at 63, and the MACD remains within positive territory. The pair, however, is likely to find some resistance in the area between the September 2 high, at 1.3815, which is under pressure at the moment, and 1.3825, where the pair was contained on August 22,25, and 26.
The pair might need further reasons to break above these levels, but if that area gives way, bulls will aim for the August 26 high, at 1.3855, ahead of the August 22 high, at 1.3925.
To the downside, Wednesday’s low, at 1.3785, is likely to challenge sellers in a potential bearish reversal. Below here, the key support area is the 1.3720-1.3730 area, August 7 and August 29 lows, and the bottom of the last six weeks’ trading range. Further down, the next target would be the July 27 low, near 1.3690.
Canadian Dollar Price Today
The table below shows the percentage change of Canadian Dollar (CAD) against listed major currencies today. Canadian Dollar was the strongest against the Australian Dollar.
| USD | EUR | GBP | JPY | CAD | AUD | NZD | CHF | |
|---|---|---|---|---|---|---|---|---|
| USD | 0.05% | 0.11% | 0.13% | 0.12% | 0.23% | 0.03% | 0.13% | |
| EUR | -0.05% | 0.06% | 0.05% | 0.08% | 0.24% | -0.01% | 0.03% | |
| GBP | -0.11% | -0.06% | 0.08% | 0.00% | 0.16% | -0.07% | -0.04% | |
| JPY | -0.13% | -0.05% | -0.08% | 0.00% | 0.03% | -0.04% | 0.01% | |
| CAD | -0.12% | -0.08% | -0.01% | -0.01% | 0.07% | -0.06% | -0.04% | |
| AUD | -0.23% | -0.24% | -0.16% | -0.03% | -0.07% | -0.24% | -0.19% | |
| NZD | -0.03% | 0.01% | 0.07% | 0.04% | 0.06% | 0.24% | 0.09% | |
| CHF | -0.13% | -0.03% | 0.04% | -0.01% | 0.04% | 0.19% | -0.09% |
The heat map shows percentage changes of major currencies against each other. The base currency is picked from the left column, while the quote currency is picked from the top row. For example, if you pick the Canadian Dollar from the left column and move along the horizontal line to the US Dollar, the percentage change displayed in the box will represent CAD (base)/USD (quote).
More By This Author:
Japanese Yen Struggles Amid BoJ Ambiguity And Political UncertaintyJapanese Yen Seems Vulnerable Amid Political Uncertainty, BoJ Rate Hike Ambiguity
USD/JPY Steadies Above 148.00 As Mixed U.S. PMI Data Shifts Focus To NFP


Comments
Log in or sign up to join the conversation.