
- USD/CAD gains ground despite a bearish bias suggested by daily chart analysis.
- The momentum indicator MACD also suggests a bearish trend for the pair.
- A break above the upper boundary of the descending channel and the psychological level of 1.3700 could weaken the bearish bias.
USD/CAD halts its three-day losing streak, trading around 1.3680 during the European hours on Tuesday. The appreciation of the pair is attributed to the decline in crude Oil prices, given the fact that Canada is the largest Oil exporter to the United States (US).
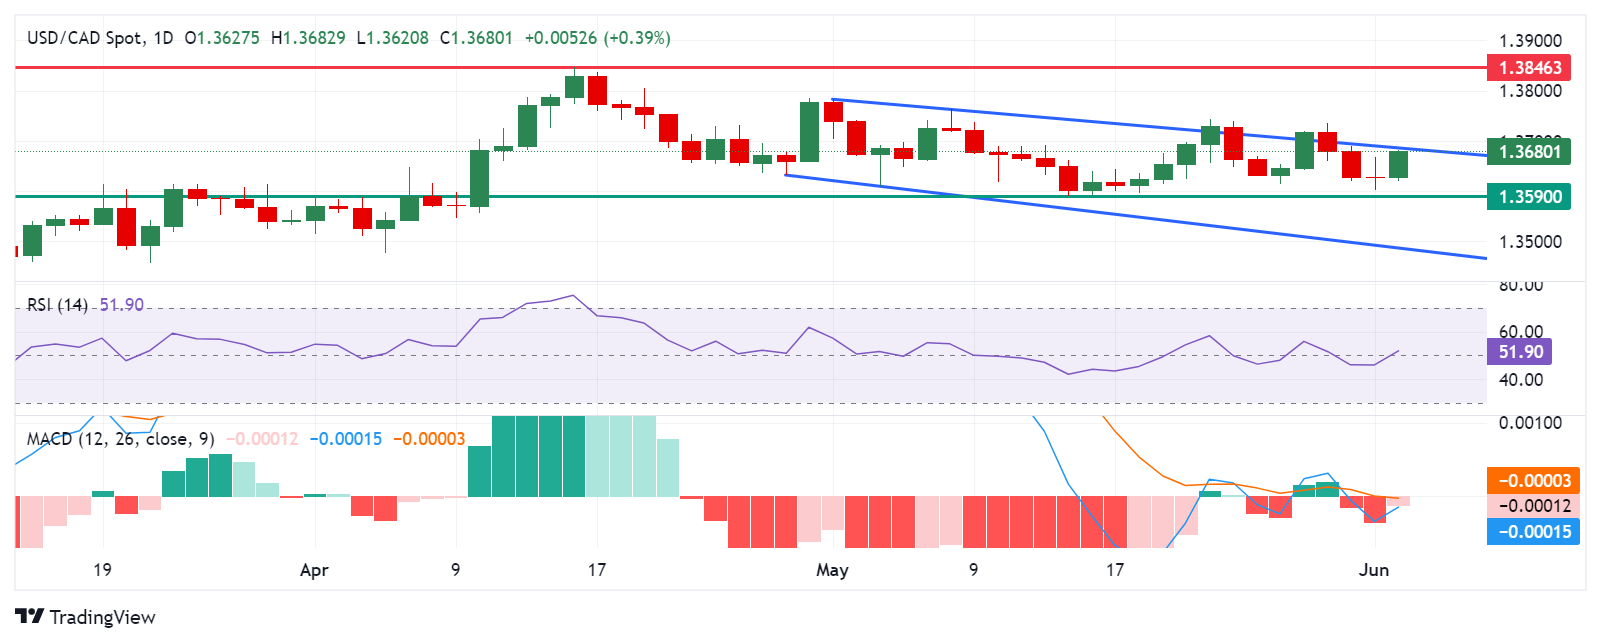
The analysis of the daily chart suggests the bearish bias for the USD/CAD pair, as it lies within the descending channel. Additionally, the 14-day Relative Strength Index (RSI) is positioned slightly above the 50 level, further movement may offer a clear directional trend.
The momentum indicator Moving Average Convergence Divergence (MACD) also suggests a bearish trend for the USD/CAD pair as the MACD line is positioned below the centerline and the signal line. However, the convergence below the signal line could lead to a momentum shift. A breakthrough above the centerline could weaken the bearish trend.
The USD/CAD pair could find the key support around the psychological level of 1.3600 and a throwback support of 1.3590. A break below this region could exert downward pressure on the pair to navigate around the significant level of 1.3500. Further support may appear at the lower threshold of the descending channel.
On the upside, the USD/CAD pair tests the upper boundary of the descending channel, followed by the psychological level of 1.3700. A breakthrough above the latter could weaken the bearish bias and lead the pair to explore the region around the key level of 1.3800, followed by April’s high of 1.3846.
USD/CAD: Daily Chart
(Click on image to enlarge)
USD/CAD
| OVERVIEW | |
|---|---|
| Today last price | 1.3679 |
| Today Daily Change | 0.0052 |
| Today Daily Change % | 0.38 |
| Today daily open | 1.3627 |
| TRENDS | |
|---|---|
| Daily SMA20 | 1.3662 |
| Daily SMA50 | 1.3662 |
| Daily SMA100 | 1.3582 |
| Daily SMA200 | 1.3575 |
| LEVELS | |
|---|---|
| Previous Daily High | 1.3669 |
| Previous Daily Low | 1.3603 |
| Previous Weekly High | 1.3735 |
| Previous Weekly Low | 1.3615 |
| Previous Monthly High | 1.3783 |
| Previous Monthly Low | 1.359 |
| Daily Fibonacci 38.2% | 1.3628 |
| Daily Fibonacci 61.8% | 1.3644 |
| Daily Pivot Point S1 | 1.3597 |
| Daily Pivot Point S2 | 1.3567 |
| Daily Pivot Point S3 | 1.3532 |
| Daily Pivot Point R1 | 1.3663 |
| Daily Pivot Point R2 | 1.3699 |
| Daily Pivot Point R3 | 1.3729 |
More By This Author:
Japanese Yen Depreciates As Global Bond Yields Reduce Safe-Haven DemandWTI Drops Below $74.00 As OPEC+ Plans To Ease Oil Production Cuts
Australian Dollar Stays Calm As Traders Adopt Caution Ahead Of US PCE


Comments
Log in or sign up to join the conversation.