USD/CAD Price Analysis: Hovers Above 1.3650 Major Level On Surging US Dollar
- USD/CAD moves above 1.3650 due to the upbeat US Dollar.
- Technical indicators suggest a bullish momentum in the price movement.
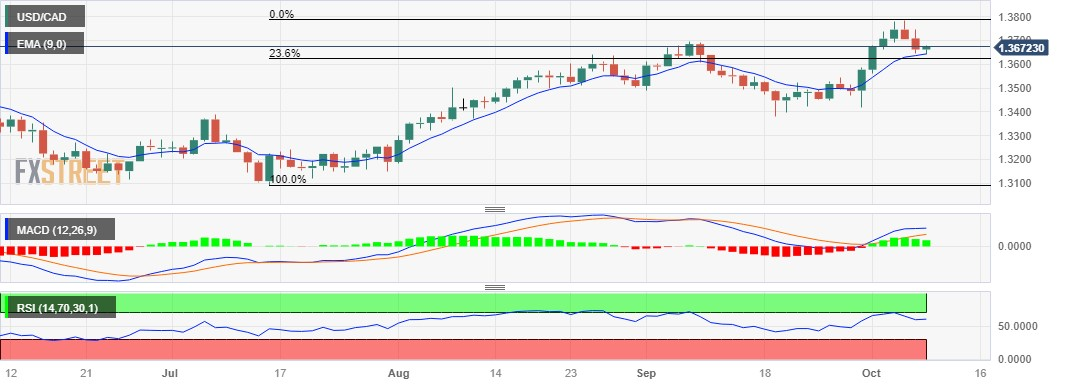
- The nine-day EMA emerges as immediate support, followed by the 23.6% Fibonacci retracement.
USD/CAD snaps the two-day losing streak, trading higher around 1.3670 aligned with the 1.3700 psychological level during the early European session on Monday. The pair is receiving upward support due to a recovery in the US Dollar (USD).
A firm break above the latter could open the doors for the USD/CAD pair to explore an area near the major level at 1.3750 lined up with the previous week’s high at 1.3785, following the 1.3800 psychological level.
However, the USD/CAD pair faced downward pressure due to surging oil prices, which could be attributed to the Palestine-Israel military conflict.
The deteriorating geopolitical tensions could impact the Canadian Dollar (CAD), especially since Canada is the largest oil exporter to the United States (US).
On the downside, the psychological level at 1.3650 could act as an immediate barrier lined up with the nine-day Exponential Moving Average (EMA) at 1.3643, followed by the 23.6% Fibonacci retracement at 1.3622 level.
The Moving Average Convergence Divergence (MACD) indicator is indicating stronger momentum in the price movement as it lies above the centerline and the signal line. This configuration suggests an upward trend in the market.
However, the prevailing upward momentum in the USD/CAD pair indicates a bullish bias, as the 14-day Relative Strength Index (RSI) remains above the 50 level.
USD/CAD: Daily Chart
(Click on image to enlarge)
USD/CAD: Important Levels To Watch
| OVERVIEW | |
|---|---|
| Today last price | 1.3671 |
| Today Daily Change | 0.0009 |
| Today Daily Change % | 0.07 |
| Today daily open | 1.3662 |
| TRENDS | |
|---|---|
| Daily SMA20 | 1.3555 |
| Daily SMA50 | 1.3522 |
| Daily SMA100 | 1.3414 |
| Daily SMA200 | 1.3462 |
| LEVELS | |
|---|---|
| Previous Daily High | 1.3746 |
| Previous Daily Low | 1.3644 |
| Previous Weekly High | 1.3786 |
| Previous Weekly Low | 1.3562 |
| Previous Monthly High | 1.3694 |
| Previous Monthly Low | 1.3379 |
| Daily Fibonacci 38.2% | 1.3683 |
| Daily Fibonacci 61.8% | 1.3707 |
| Daily Pivot Point S1 | 1.3622 |
| Daily Pivot Point S2 | 1.3582 |
| Daily Pivot Point S3 | 1.3519 |
| Daily Pivot Point R1 | 1.3724 |
| Daily Pivot Point R2 | 1.3786 |
| Daily Pivot Point R3 | 1.3826 |
More By This Author:
EUR/JPY Rallied To A Four-Day High, Above 158.00
AUD/USD Rebounded To 0.6400 On US Dollar's NFP-Fueled Retreat
EUR/USD Bounds Higher Post-NFP, Taps Into 1.0600
Disclosure: Information on this article contains forward-looking statements that involve risks and uncertainties. Markets and instruments profiled on this page are for informational purposes ...
more


