
Photo by Michelle Spollen on Unsplash
- USD/CAD bounces back strongly after upbeat US preliminary S&P Global PMI report for June.
- Canadian Retail Sales grew expectedly by 0.7%.
- The Fed is expected to deliver two rate cuts this year.
The USD/CAD pair recovers strongly from 11-day low near 1.3670 in Friday’s American session. The Loonie asset bounces back as the US Dollar (USD) extends its upside after the US S&P Global PMI data for June shows that the Composite PMI surprisingly outperformed expectations that were pointing to slowdown in activity.
The US Dollar Index (DXY), which tracks the Greenback’s value against six major currencies, jumps to six-week high near 105.90.
However, investors are still uncertain about the US Dollar’s outlook as investors expect that the Federal Reserve (Fed) will start reducing interest rates from the September meeting. Market participants expect that the Fed will cut interest rates twice this year. On the contrary, Fed policymakers continue to argue in favor of reducing interest rates only once this year.
Meanwhile, the Canadian Dollar barely moved as Canada’s Retail Sales for April grew in line with expectations of 0.7% month-on-month. The Retail Sales data comes out positive after contracting for straight three months.
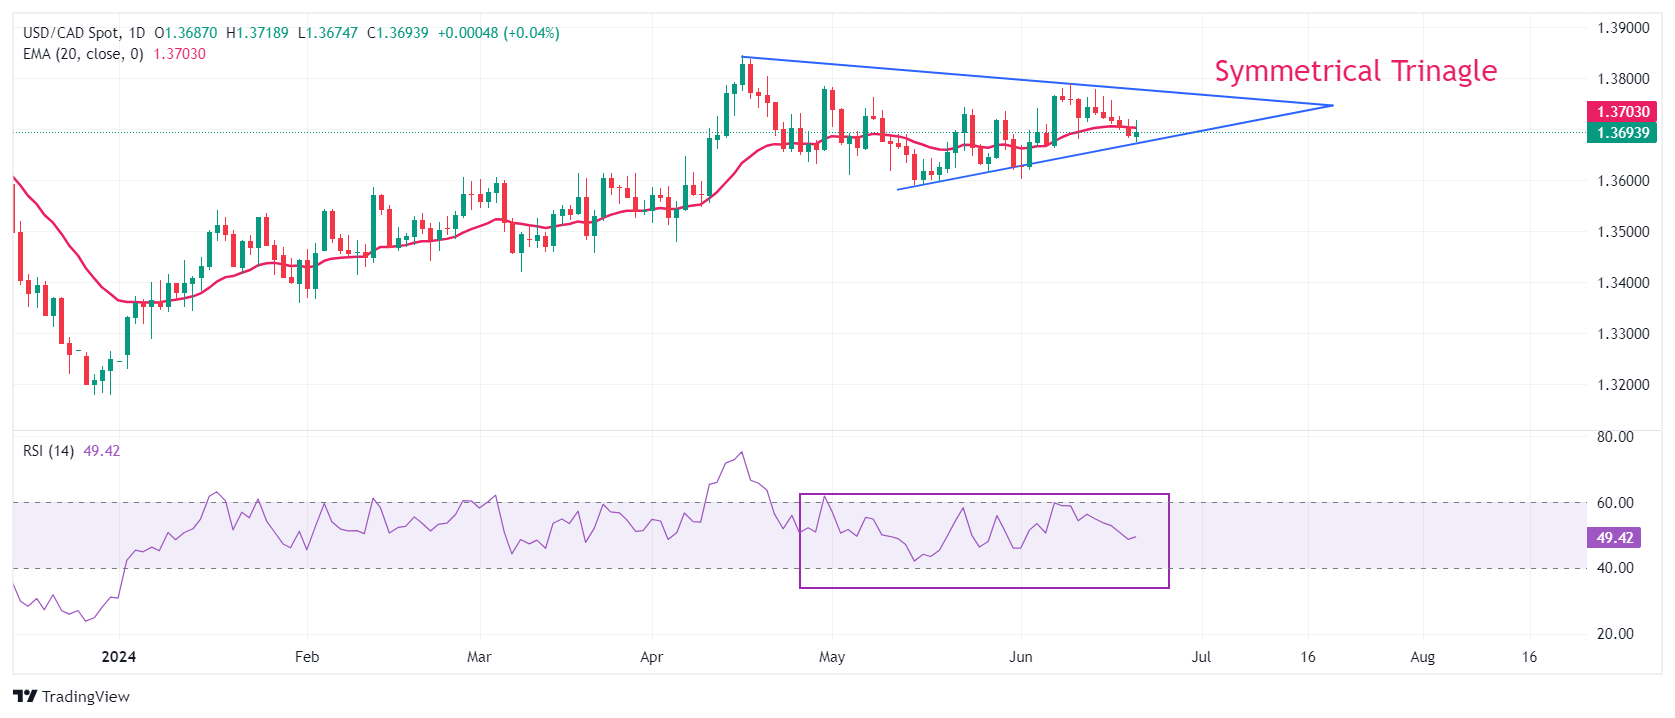
USD/CAD trades in a Symmetrical Triangle chart pattern, which indicates a sharp volatility contraction. Spot prices remain sticky to the 20-day Exponential Moving Average (EMA) near 1.3700, indicating a sideways trend.
The 14-period Relative Strength Index (RSI) oscillates in the 40.00-60.00 range, suggesting indecisiveness among market participants.
Fresh buying opportunity would emerge if the asset breaks above the April 17 high at 1.3838. This would drive the asset towards the 1 November 2023 high at 1.3900, followed by the psychological resistance of 1.4000.
In an alternate scenario, a breakdown below the June 7 low at 1.3663 will expose the asset to a May 3 low around 1.3600 and an April 9 low around 1.3547.
USD/CAD daily chart
USD/CAD
| OVERVIEW | |
|---|---|
| Today last price | 1.3692 |
| Today Daily Change | 0.0003 |
| Today Daily Change % | 0.02 |
| Today daily open | 1.3689 |
| TRENDS | |
|---|---|
| Daily SMA20 | 1.3698 |
| Daily SMA50 | 1.3698 |
| Daily SMA100 | 1.3615 |
| Daily SMA200 | 1.3584 |
| LEVELS | |
|---|---|
| Previous Daily High | 1.3721 |
| Previous Daily Low | 1.3682 |
| Previous Weekly High | 1.3792 |
| Previous Weekly Low | 1.368 |
| Previous Monthly High | 1.3783 |
| Previous Monthly Low | 1.359 |
| Daily Fibonacci 38.2% | 1.3697 |
| Daily Fibonacci 61.8% | 1.3706 |
| Daily Pivot Point S1 | 1.3674 |
| Daily Pivot Point S2 | 1.3659 |
| Daily Pivot Point S3 | 1.3635 |
| Daily Pivot Point R1 | 1.3713 |
| Daily Pivot Point R2 | 1.3736 |
| Daily Pivot Point R3 | 1.3751 |
More By This Author:
EUR/USD Slumps Due To Weak Eurozone PMIs, Firm US DollarSilver Price Forecast: XAG/USD Stays Firm Above $29 Amid Firm Fed Rate-Cut Hopes
WTI Posts Fresh Six-Week High Near $81.00 On Geopolitical Uncertainty And Firm Fed Rate-Cut Bets


Comments
Log in or sign up to join the conversation.