
- USD/CAD falls to 1.3500 due to multiple headwinds.
- The US Dollar corrects further on the weak US ISM Services PMI report.
- Higher Oil prices due to deepening supply concerns boosted the Canadian Dollar.
The USD/CAD pair falls sharply to the psychological support of 1.3500 in the European session on Thursday. The Loonie asset faces an intense sell-off as the US Dollar weakens and global Oil prices remain broadly strong.
The US Dollar Index (DXY), which values the US Dollar against six major currencies, corrects to 104.00 as weak United States ISM Services PMI report for March casts doubts over economic resilience. 10-year US Treasury yields rose as Federal Reserve (Fed) policymakers demanded more data before considering rate cuts.
On Wednesday, Fed Chair Jerome Powell said in a speech, "Recent readings on both job gains and inflation have come in higher than expected," Powell maintained the baseline that rate cuts will start later this year only when policymakers "have greater confidence that inflation is moving sustainably down.
Meanwhile, higher global oil prices have strengthened the Canadian Dollar. West Texas Intermediate (WTI) futures on NYMEX are slightly down near $85.35 but have come higher significantly this week. The Oil price rose after Ukraine’s drone attacks on Russian oil refineries deepened supply concerns. It is worth noting that Canada is the leading exporter of oil to the United States, and higher Oil prices strengthen the Canadian Dollar.
Going forward, the US Dollar and the Canadian Dollar will be guided by the Employment data from their respective economies, which will be published on Friday.
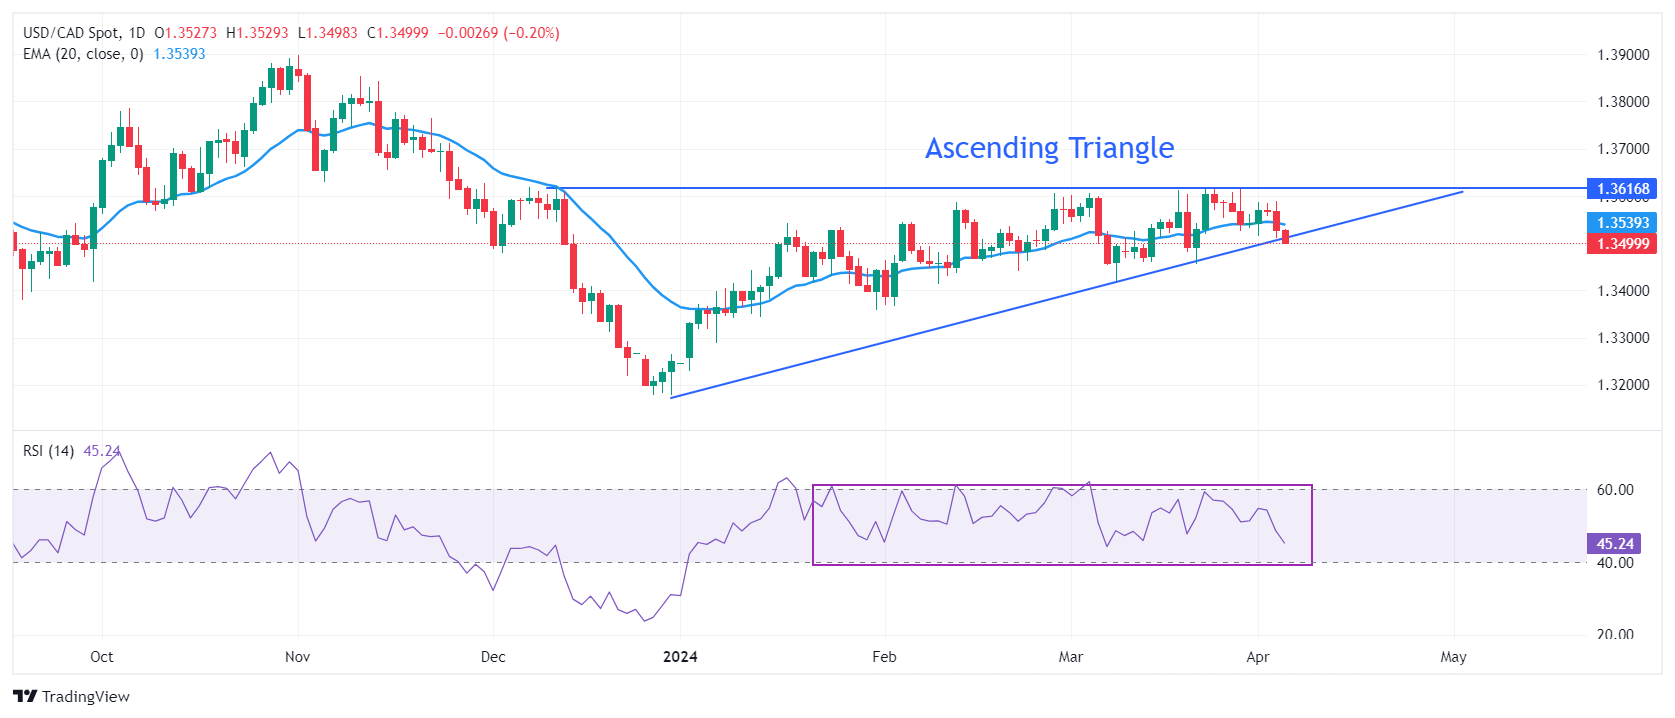
USD/CAD seems close to exploding the Ascending Triangle pattern formed on a daily time. The upward-sloping border of the aforementioned pattern is placed from December 27 low at 1.3177 while horizontal resistance is plotted from December 7 high at 1.3620. The chart pattern exhibits a sharp volatility contraction and a breakout can happen in any direction.
The asset drops below the 20-day Exponential Moving Average (EMA) near 1.3520, suggesting that the near-term appeal is weak.
The 14-period Relative Strength Index (RSI) oscillates inside the 40.00-60.00 range, indicating indecisiveness among investors.
A downside move below February 22 low at 1.3441 would expose the asset to February 9 low at 1.3413. A breakdown below the latter would extend downside towards January 15 low at 1.3382.
On the flip side, the Loonie asset would observe a fresh upside if it breaks above December 7 high at 1.3620. This will drive the asset towards May 26 high at 1.3655, followed by the round-level resistance of 1.3700.
USD/CAD daily chart
(Click on image to enlarge)
USD/CAD
| OVERVIEW | |
|---|---|
| Today last price | 1.35 |
| Today Daily Change | -0.0027 |
| Today Daily Change % | -0.20 |
| Today daily open | 1.3527 |
| TRENDS | |
|---|---|
| Daily SMA20 | 1.3534 |
| Daily SMA50 | 1.3511 |
| Daily SMA100 | 1.3489 |
| Daily SMA200 | 1.3502 |
| LEVELS | |
|---|---|
| Previous Daily High | 1.3589 |
| Previous Daily Low | 1.3512 |
| Previous Weekly High | 1.3614 |
| Previous Weekly Low | 1.3525 |
| Previous Monthly High | 1.3614 |
| Previous Monthly Low | 1.342 |
| Daily Fibonacci 38.2% | 1.3541 |
| Daily Fibonacci 61.8% | 1.356 |
| Daily Pivot Point S1 | 1.3496 |
| Daily Pivot Point S2 | 1.3465 |
| Daily Pivot Point S3 | 1.3418 |
| Daily Pivot Point R1 | 1.3573 |
| Daily Pivot Point R2 | 1.362 |
| Daily Pivot Point R3 | 1.3651 |
More By This Author:
Gold Price Refreshes All-Time Highs Below $2,300 As Geopolitical Tensions EscalateUSD/CAD Price Analysis: Consolidates Around 1.3580 Ahead Of US Job Data
AUD/USD Price Analysis: Remains stuck in tight range slightly above 0.6500


Comments
Log in or sign up to join the conversation.