
USDCAD Forecast: Retracement Or Major Trend Change?
BoC kept the interest rates benchmark unchanged and injected a maple dose of dovish rhetoric into the market. On the other hand; the Fed is prepared to cut interest rates soon despite record stock prices, low unemployment and core inflation above 2.0% because it’s worried about the economy. After 2,5 years Core CPI moved above UST10. That’s why Fed Chairman Jerome Powell isn’t really focused on the economy itself — it’s doing OK, actually. He’s nervous about what economists like to call internal or external “shocks.” A trade war certainly qualifies as one.
Rising Oil prices support the Canadian Dollar. The BoC is expected to end 2019 without a single rate move.
The Surprise Index has been clearly positive for Canada. It puts a large weight on headline employment and the unemployment rate. But as we showed last week, the quality of those job gains means the apparently tight labor market hasn’t translated into particularly strong consumer spending or GDP growth. Indeed, 2019 GDP estimates for Canada have actually fallen further below those for the US even with the “positive” data surprises.
Economic Calendar of USDCAD
Tuesday: U.S Production Data Set
Wednesday: U.S Housing Data, Canada CPI and Manufacturing Sales
Thursday: U.S Philadelphia FED Manufacturing Index, Canada ADP Non-Farm Employment Change
Friday: Canada Retail Sales
Weekly Chart: Bearish.
Loonie ended the week below SMA 20, EMA50, SMA200. SMA 100 support resides at 1.29700. Inside the Ichimoku Cloud. Cloud support at1.29500.
Daily Chart: Bearish
The price is below all main Moving Averages.RSI is above 30 and has downside rooms. Murrey Math 2/8 Major Support resides @ 1.29390.
H4 Chart: Bearish
The price is below all main Moving Averages.RSI is above 30 and has downside rooms. Murrey Math – 2/8 Extremely Oversold resides @ 1.29700
Intraday Key Levels:
Upside: 1.30460 1.30610 1.30920
Downside: 1.30150 1.30000 1.29700
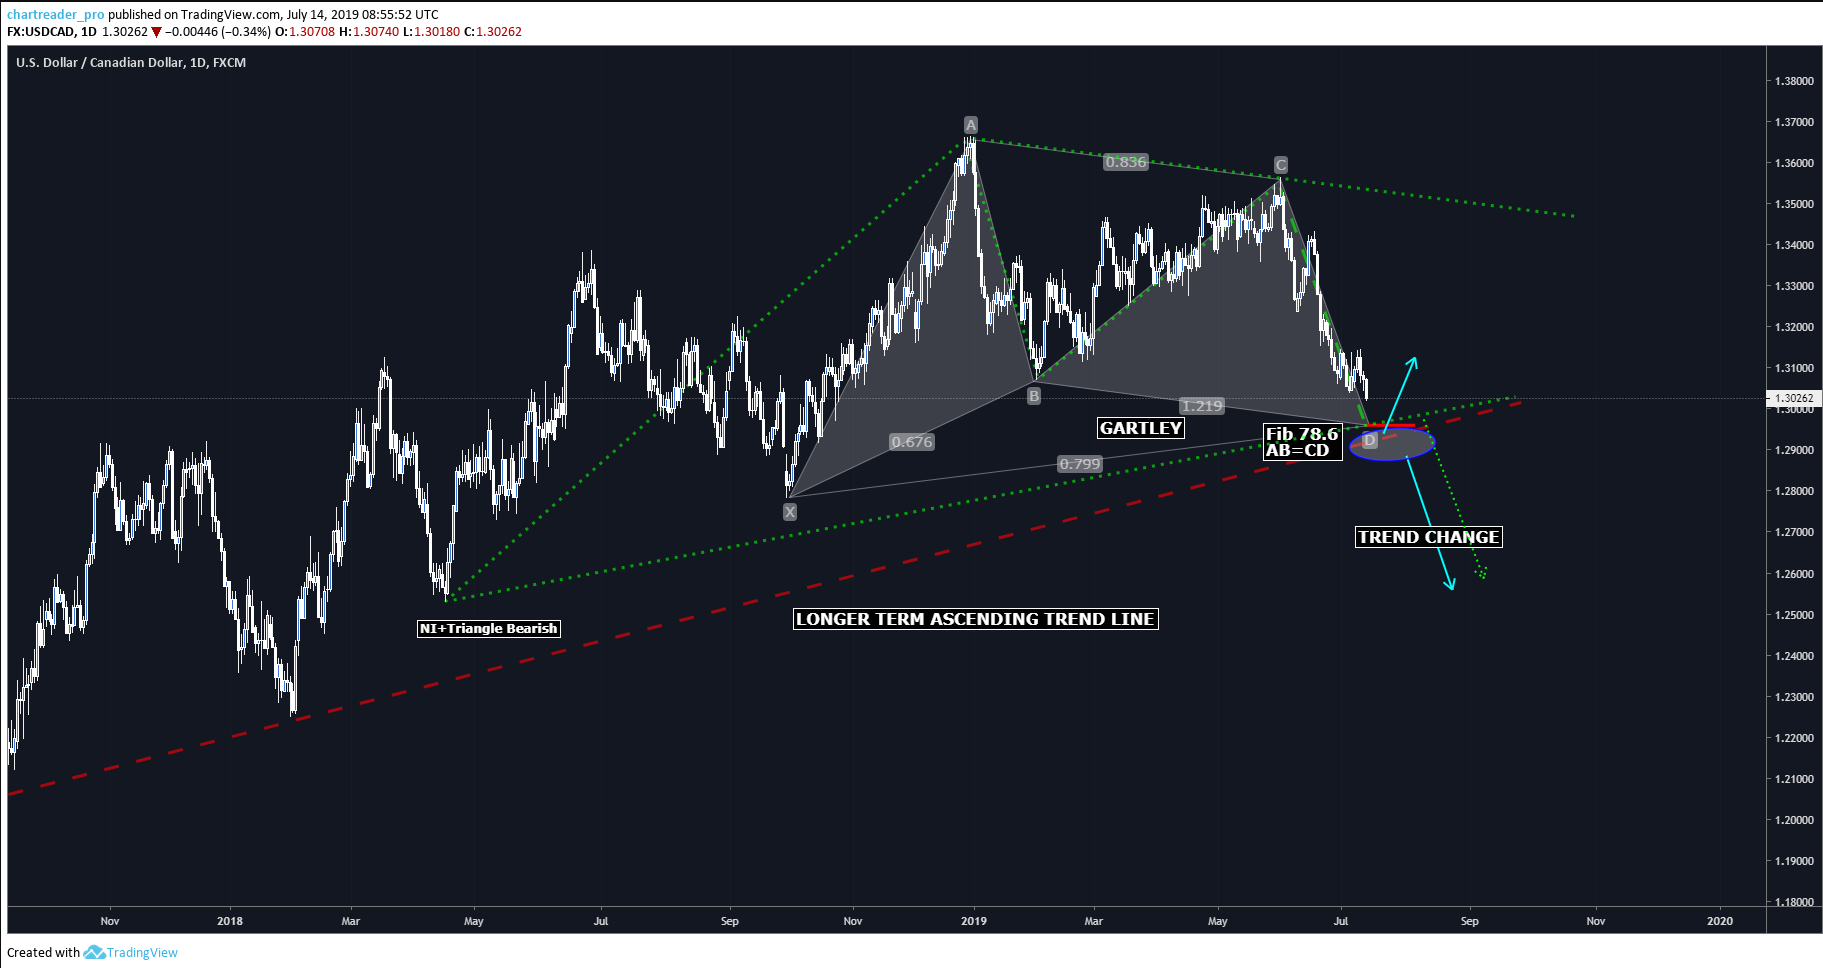
Chart Patterns:
Daily Chart: Bullish Gartley and AB=CD patterns @ 1.29700
H1 Chart: Emerging Bearish Cypher Pattern @ 1.31200
Our Comments:
A break below 1.30150 could send the pair 1.29700. A potential breakout of the trend line and daily closing below 1.29500 would confirm the medium term trend change. 1.28170 will be the next target of the pair.
If the pair fails to break below 1.30150, it is likely to test 1.30900 resistance. However, the upside is capped by the SMA 100 H4 chart at 1.31200.
Medium Term Trade Opportunities:
Long Opportunity at 1.29700
Short Opportunity at 1.31200
Disclosure:
This chart has been published for educational purposes only and cannot be considered as trading advice. This pattern/ analysis prepared by the global analysts ...
more


Good stuff.