
USD/CAD Final Zigzag [Z] Heading To 1.296
(Click on image to enlarge)
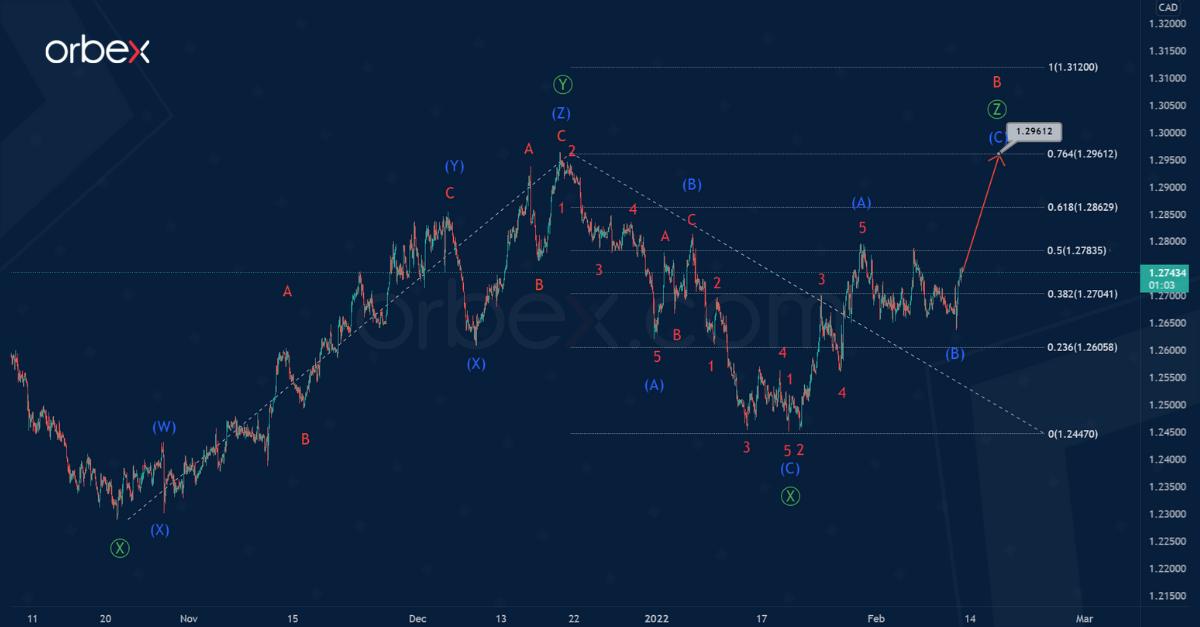
The current USD/CAD structure indicates the formation of a bullish zigzag [Z] consisting of sub-waves (A)-(B)-(C) and being a simple zigzag.
This simple zigzag is located in the last part of the triple three [W]-[X]-[Y]-[X]-[Z]. Wave [Y] has taken the form of a triple zigzag. Wave [X] is a simple bearish zigzag (A)-(B)-(C), which is also fully complete.
The wave (C), which is currently under development, marked with a blue letter, is of the greatest interest at the moment. At the level of 1.296, the entire wave [Z] will be at 76.4% of wave [Y]. So at that level, we can expect the completion of the impulse (C). This is currently under construction.
(Click on image to enlarge)

Alternatively, the development of the primary bearish intervening wave [X] consisting of sub-waves (W)-(X)-(Y) has ended. These sub-waves all together make up a bearish triple zigzag. And within all the active parts are zigzags A-B-C, consisting of minor waves.
(W) and (X) could have fully formed, while (Y) is still under construction. As part of the wave (Y), the development of correction B has recently finished. In the short term, market participants can expect a decline in the impulse wave C to the 1.245 area.
The target is determined by the previous minimum, which was formed by the wave (W).
Disclaimer: Orbex LIMITED is a fully licensed and Regulated Cyprus Investment Firm (CIF) governed and supervised by the Cyprus Securities and Exchange Commission (CySEC) (License Number 124/10). ...
more

