
- DXY adds to Monday’s advance and retests the 103.60 zone.
- Extra gains from here target the key 200-day SMA near 105.70.
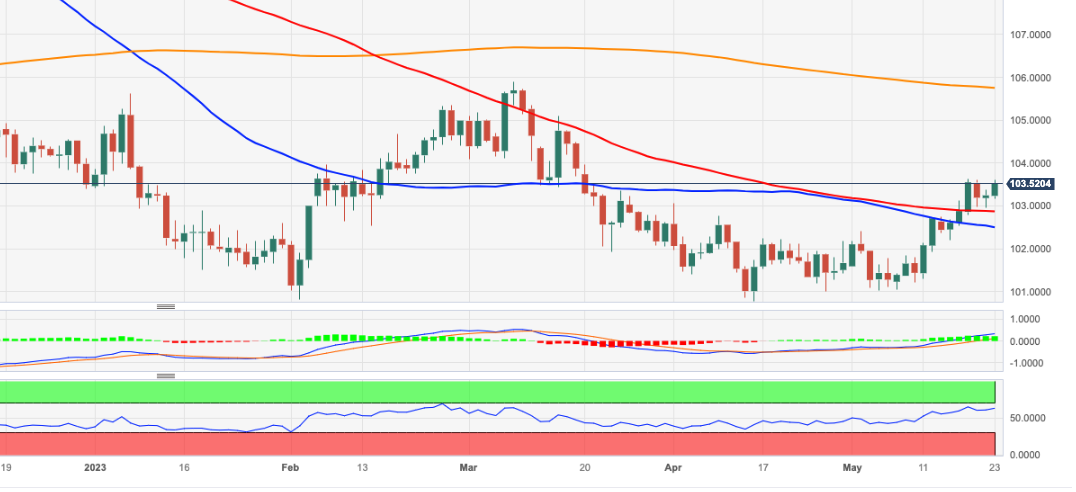
DXY extends Monday’s auspicious start of the week and challenges recent peaks in the 103.60/65 band on Tuesday.
In case bulls regain the upper hand, a convincing move past 103.60/65 could pave the way for a potential challenge of the key 200-day SMA, today at 105.74 prior to the 2023 high of 105.88 (March 8).
Looking at the broader picture, while below the 200-day SMA the outlook for the index is expected to remain negative.
DXY daily chart
(Click on image to enlarge)
Dollar Index Spot
| OVERVIEW | |
|---|---|
| Today last price | 103.54 |
| Today Daily Change | 45 |
| Today Daily Change % | 0.28 |
| Today daily open | 103.25 |
| TRENDS | |
|---|---|
| Daily SMA20 | 102.09 |
| Daily SMA50 | 102.3 |
| Daily SMA100 | 102.89 |
| Daily SMA200 | 105.69 |
| LEVELS | |
|---|---|
| Previous Daily High | 103.37 |
| Previous Daily Low | 102.96 |
| Previous Weekly High | 103.63 |
| Previous Weekly Low | 102.2 |
| Previous Monthly High | 103.06 |
| Previous Monthly Low | 100.79 |
| Daily Fibonacci 38.2% | 103.21 |
| Daily Fibonacci 61.8% | 103.12 |
| Daily Pivot Point S1 | 103.01 |
| Daily Pivot Point S2 | 102.78 |
| Daily Pivot Point S3 | 102.61 |
| Daily Pivot Point R1 | 103.42 |
| Daily Pivot Point R2 | 103.6 |
| Daily Pivot Point R3 | 103.83 |
More By This Author:
Natural Gas Futures: A Deeper Correction Is Not Favored
EUR/GBP Extends The Consolidation In The Sub-0.8700 Area
EUR/JPY Price Analysis: Some Consolidation Looks Likely Below 150.00


Comments
Log in or sign up to join the conversation.