
- DXY reverses the initial pessimism and advances to daily highs.
- Extra recovery continues to target the 104.70 region.
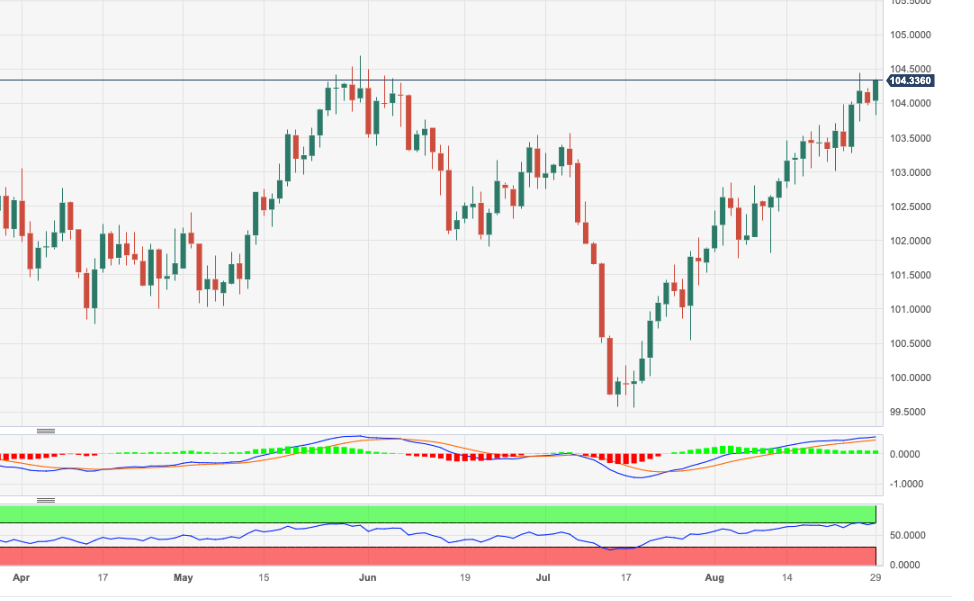
DXY quickly leaves behind Monday’s decline and resumes the uptrend to retest the 104.30/40 band on Tuesday.
Immediately to the upside turns up the August top at 104.44 (August 25), while the surpass of this level should open the door to a rapid test of the May high of 104.69 (May 31) prior to the 2023 peak of 105.88 (March 8).
While above the key 200-day SMA, today at 103.09, the outlook for the index is expected to shift to a more constructive one.
DXY daily chart
Dollar Index Spot
| OVERVIEW | |
|---|---|
| Today last price | 104.33 |
| Today Daily Change | 53 |
| Today Daily Change % | 0.31 |
| Today daily open | 104.01 |
| TRENDS | |
|---|---|
| Daily SMA20 | 103.06 |
| Daily SMA50 | 102.31 |
| Daily SMA100 | 102.46 |
| Daily SMA200 | 103.09 |
| LEVELS | |
|---|---|
| Previous Daily High | 104.22 |
| Previous Daily Low | 103.98 |
| Previous Weekly High | 104.44 |
| Previous Weekly Low | 103.01 |
| Previous Monthly High | 103.57 |
| Previous Monthly Low | 99.57 |
| Daily Fibonacci 38.2% | 104.07 |
| Daily Fibonacci 61.8% | 104.13 |
| Daily Pivot Point S1 | 103.92 |
| Daily Pivot Point S2 | 103.82 |
| Daily Pivot Point S3 | 103.67 |
| Daily Pivot Point R1 | 104.16 |
| Daily Pivot Point R2 | 104.31 |
| Daily Pivot Point R3 | 104.41 |
More By This Author:
Natural Gas Futures: Extra Gains Appear LikelyUSD Index Price Analysis: Attention Now Shifts To 104.70
EUR/JPY Price Analysis: No Changes To The Upside Target


Comments
Log in or sign up to join the conversation.