USD Index Price Analysis: The Breach Of 101.77 Exposes A Deeper Decline
- The index adds to Tuesday’s losses and returns below 102.00.
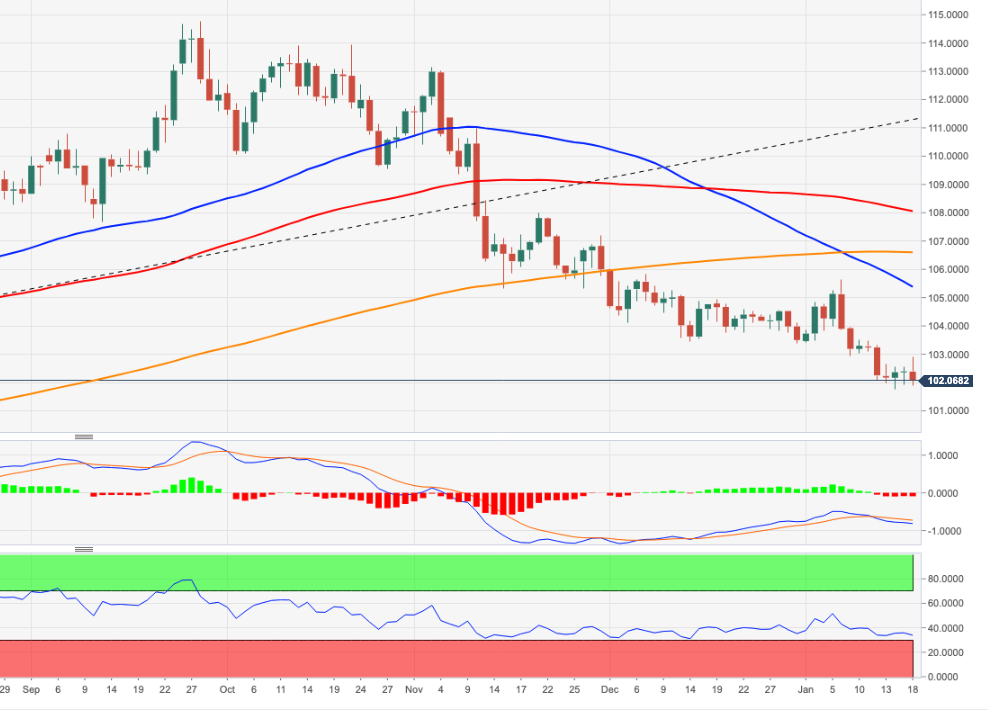
- A move below the January low at 101.77 exposes extra retracements.
The DXY trades on the defensive and revisits the area below the 102.00 mark amidst intense selling pressure on Wednesday.
So far, the continuation of the side-lined mood looks like the name of the game for the dollar, at least in the near term. In case bears regain the upper hand, the loss of the January low at 101.77 (January 16) should put a potential deeper drop to the May 2022 low around 101.30 (May 30) back on the investors’ radar prior to the psychological 100.00 level.
In the meantime, while below the 200-day SMA at 106.42 the outlook for the index should remain tilted to the negative side.
DXY daily chart
(Click on image to enlarge)
Dollar Index Spot
| OVERVIEW | |
|---|---|
| Today last price | 102.06 |
| Today Daily Change | 100 |
| Today Daily Change % | -0.32 |
| Today daily open | 102.39 |
| TRENDS | |
|---|---|
| Daily SMA20 | 103.7 |
| Daily SMA50 | 104.75 |
| Daily SMA100 | 107.82 |
| Daily SMA200 | 106.81 |
| LEVELS | |
|---|---|
| Previous Daily High | 102.57 |
| Previous Daily Low | 101.93 |
| Previous Weekly High | 103.95 |
| Previous Weekly Low | 101.99 |
| Previous Monthly High | 106.02 |
| Previous Monthly Low | 103.39 |
| Daily Fibonacci 38.2% | 102.32 |
| Daily Fibonacci 61.8% | 102.17 |
| Daily Pivot Point S1 | 102.03 |
| Daily Pivot Point S2 | 101.66 |
| Daily Pivot Point S3 | 101.39 |
| Daily Pivot Point R1 | 102.66 |
| Daily Pivot Point R2 | 102.93 |
| Daily Pivot Point R3 | 103.3 |
More By This Author:
Natural Gas Futures: A Deeper Pullback Looks Favored
Natural Gas Futures: Extra Gains Likely
Natural Gas Futures: Extra Losses Appear Favored In The Short-Term


