
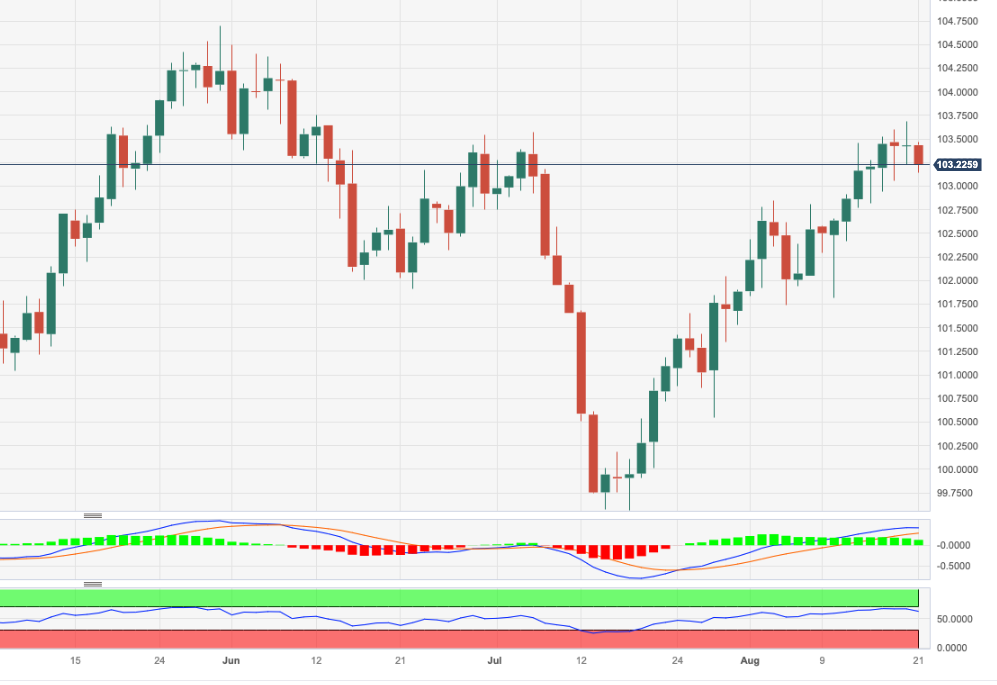
- DXY comes under pressure after hitting fresh tops near 103.70.
- The 200-day SMA near 103.20 underpins the index so far.
DXY faces extra selling pressure and revisits the 103.15/10 band at the beginning of the week.
In spite of Monday’s corrective move, the index maintains the bullish view well in place with the immediate hurdle now emerging at the May top of 104.69 (May 31) ahead of the 2023 peak of 105.88 (March 8).
It is worth noting that this area of monthly highs appears reinforced by the proximity of the key 200-day SMA, today at 103.18.
Looking at the broader picture, a convincing breakout of the 200-day SMA should shift the outlook for the index to a more constructive one.
DXY daily chart
(Click on image to enlarge)
Dollar Index Spot
| OVERVIEW | |
|---|---|
| Today last price | 103.24 |
| Today Daily Change | 33 |
| Today Daily Change % | -0.18 |
| Today daily open | 103.43 |
| TRENDS | |
|---|---|
| Daily SMA20 | 102.38 |
| Daily SMA50 | 102.19 |
| Daily SMA100 | 102.36 |
| Daily SMA200 | 103.16 |
| LEVELS | |
|---|---|
| Previous Daily High | 103.68 |
| Previous Daily Low | 103.22 |
| Previous Weekly High | 103.68 |
| Previous Weekly Low | 102.77 |
| Previous Monthly High | 103.57 |
| Previous Monthly Low | 99.57 |
| Daily Fibonacci 38.2% | 103.51 |
| Daily Fibonacci 61.8% | 103.4 |
| Daily Pivot Point S1 | 103.21 |
| Daily Pivot Point S2 | 102.99 |
| Daily Pivot Point S3 | 102.75 |
| Daily Pivot Point R1 | 103.67 |
| Daily Pivot Point R2 | 103.9 |
| Daily Pivot Point R3 | 104.13 |
More By This Author:
Natural Gas Futures: Extra Weakness In The PipelineEUR/USD Price Analysis: A Drop To 1.0833 Remains In Store
Natural Gas Futures: Further Decline On The Cards


Comments
Log in or sign up to join the conversation.