

Image Source: Pexels
- DXY remains under pressure, albeit off earlier lows in the sub-102.00 zone.
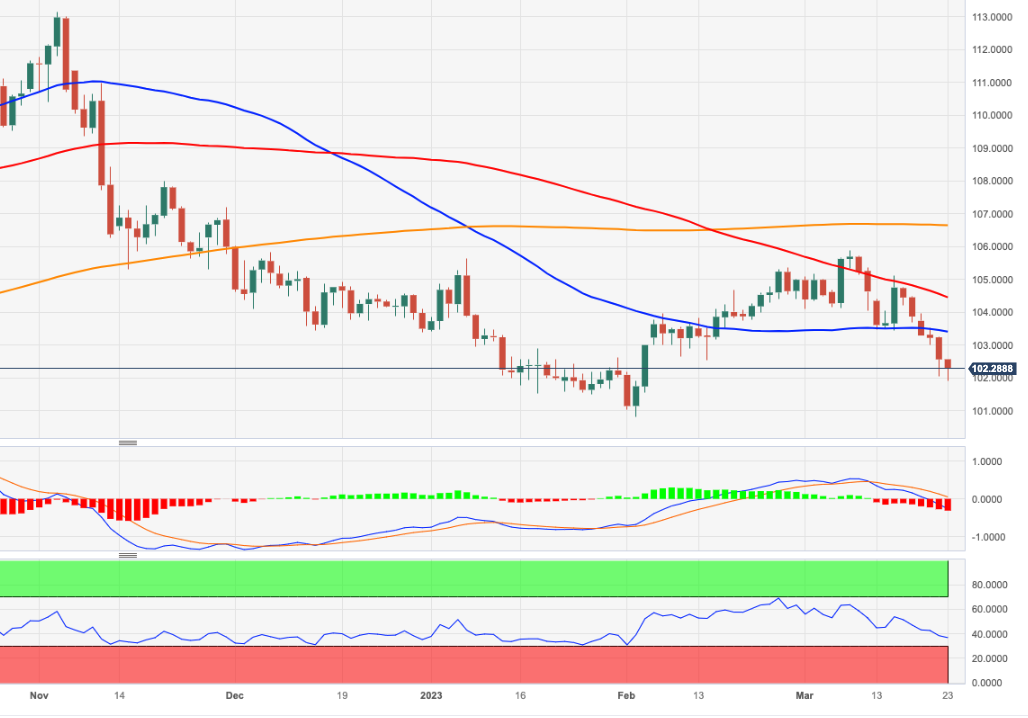
- Below the 102.00 region, the index could retest the 2023 low.
DXY retreats for the sixth consecutive session and keeps navigating the multi-week zone in the low-102.00s.
The bearish mood appears unabated for the time being. Against that, the breach of the March low at 101.91 (March 23) should put a potential test of the 2023 low near 100.82 (February 2) back on the investors’ radar.
Looking at the broader picture, while below the 200-day SMA, today at 106.60, the outlook for the index is expected to remain negative.
DXY daily chart
(Click on image to enlarge)
Dollar Index Spot
| OVERVIEW | |
|---|---|
| Today last price | 102.25 |
| Today Daily Change | 58 |
| Today Daily Change % | -0.31 |
| Today daily open | 102.57 |
| TRENDS | |
|---|---|
| Daily SMA20 | 104.41 |
| Daily SMA50 | 103.43 |
| Daily SMA100 | 104.26 |
| Daily SMA200 | 106.8 |
| LEVELS | |
|---|---|
| Previous Daily High | 103.26 |
| Previous Daily Low | 102.05 |
| Previous Weekly High | 105.11 |
| Previous Weekly Low | 103.44 |
| Previous Monthly High | 105.36 |
| Previous Monthly Low | 100.81 |
| Daily Fibonacci 38.2% | 102.52 |
| Daily Fibonacci 61.8% | 102.8 |
| Daily Pivot Point S1 | 101.99 |
| Daily Pivot Point S2 | 101.42 |
| Daily Pivot Point S3 | 100.78 |
| Daily Pivot Point R1 | 103.2 |
| Daily Pivot Point R2 | 103.84 |
| Daily Pivot Point R3 | 104.41 |
More By This Author:
Natural Gas Futures: Further Decline Not Favored Near Term
Natural Gas Futures: Further Advances Appear Favored
Natural Gas Futures: Extra Decline In Store Near Term


Comments
Log in or sign up to join the conversation.