
- DXY now reverses two daily pullbacks in a row on Friday.
- Further recovery targets the YTD top near 107.30.
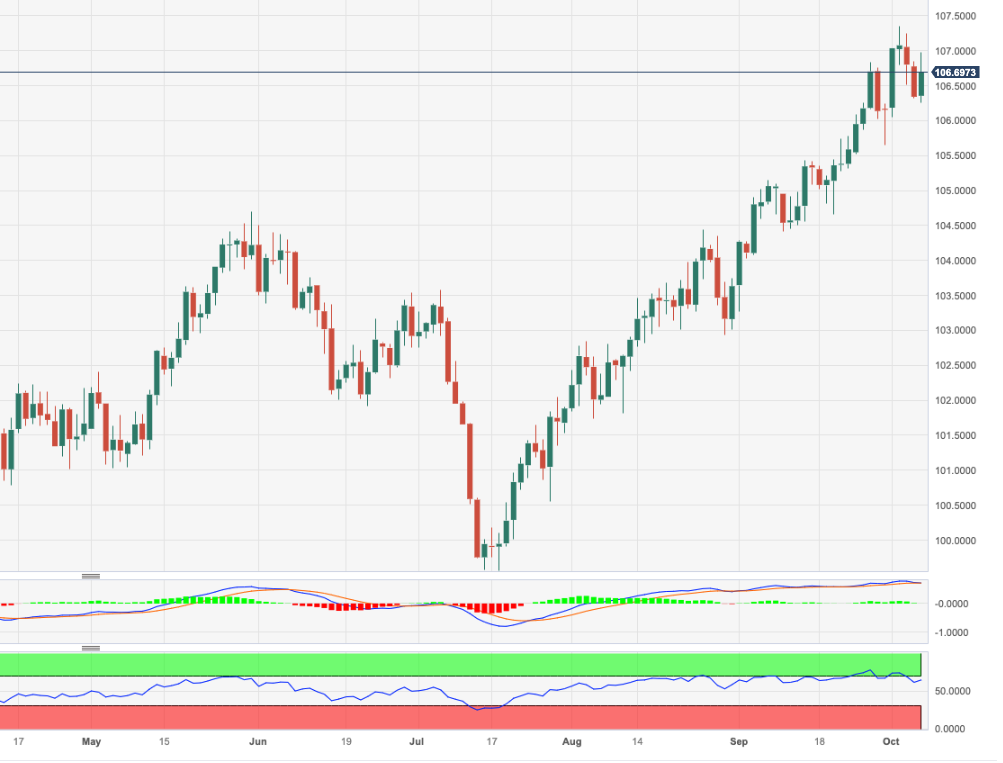
DXY stages quite a marked comeback and sets aside two consecutive sessions of losses on Friday.
Considering the ongoing price action, extra gains appear likely in the dollar for the time being. Once the index clears the 2023 top of 107.34 (October 3), it could encourage bulls to challenge the weekly peak at 107.99 (November 21 2022) just ahead of the round level at 108.00.
In the meantime, while above the key 200-day SMA, today at 103.16, the outlook for the index is expected to remain constructive.
DXY daily chart
(Click on image to enlarge)
Dollar Index Spot
| OVERVIEW | |
|---|---|
| Today last price | 106.77 |
| Today Daily Change | 72 |
| Today Daily Change % | 0.40 |
| Today daily open | 106.34 |
| TRENDS | |
|---|---|
| Daily SMA20 | 105.73 |
| Daily SMA50 | 104.25 |
| Daily SMA100 | 103.42 |
| Daily SMA200 | 103.16 |
| LEVELS | |
|---|---|
| Previous Daily High | 106.85 |
| Previous Daily Low | 106.32 |
| Previous Weekly High | 106.84 |
| Previous Weekly Low | 105.52 |
| Previous Monthly High | 106.84 |
| Previous Monthly Low | 103.27 |
| Daily Fibonacci 38.2% | 106.52 |
| Daily Fibonacci 61.8% | 106.65 |
| Daily Pivot Point S1 | 106.16 |
| Daily Pivot Point S2 | 105.97 |
| Daily Pivot Point S3 | 105.62 |
| Daily Pivot Point R1 | 106.69 |
| Daily Pivot Point R2 | 107.04 |
| Daily Pivot Point R3 | 107.22 |
More By This Author:
Natural Gas Futures: Bullish Momentum Remains In StoreEUR/USD Price Analysis: Outlook Remains Bearish Below The 200-Day SMA
USD Index Price Analysis: Another Visit To 107.00 Appears In The Pipeline


Comments
Log in or sign up to join the conversation.