
- DXY extends the advance further north of 102.00.
- Further upside should target the monthly high at 102.40.
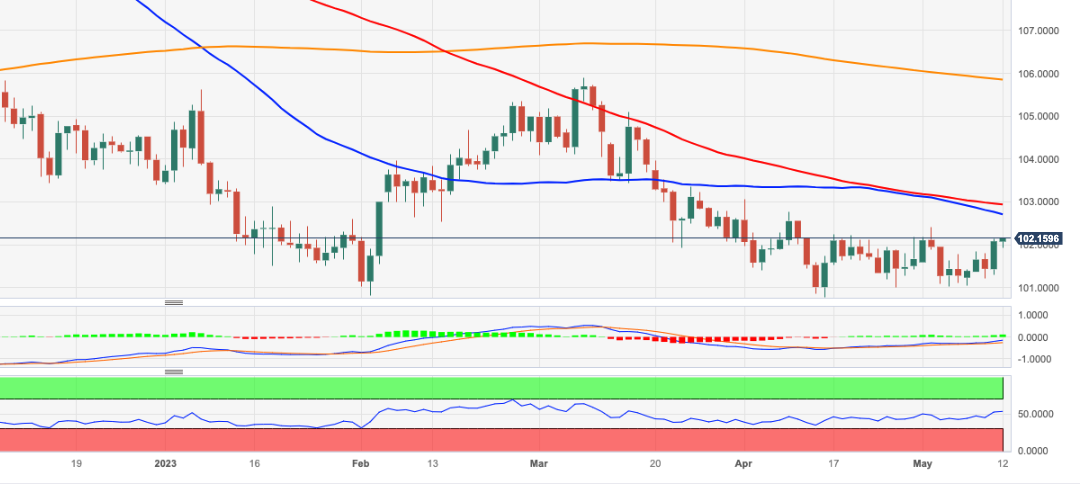
DXY adds to the weekly recovery past the 102.00 mark on Friday.
A more serious bullish attempt should clear the monthly high at 102.40 (May 2) to mitigate the downside pressure and allow for a potential advance to the provisional 55- and 100-day SMAs at 102.70 and 102.93, respectively.
On the downside, there is a formidable contention around the 101.00 neighborhood for the time being.
Looking at the broader picture, while below the 200-day SMA, today at 105.84, the outlook for the index is expected to remain negative.
DXY daily chart
(Click on image to enlarge)
Dollar Index Spot
| OVERVIEW | |
|---|---|
| Today last price | 102.13 |
| Today Daily Change | 25 |
| Today Daily Change % | 0.05 |
| Today daily open | 102.08 |
| TRENDS | |
|---|---|
| Daily SMA20 | 101.66 |
| Daily SMA50 | 102.56 |
| Daily SMA100 | 102.96 |
| Daily SMA200 | 105.9 |
| LEVELS | |
|---|---|
| Previous Daily High | 102.15 |
| Previous Daily Low | 101.3 |
| Previous Weekly High | 102.4 |
| Previous Weekly Low | 101.03 |
| Previous Monthly High | 103.06 |
| Previous Monthly Low | 100.79 |
| Daily Fibonacci 38.2% | 101.83 |
| Daily Fibonacci 61.8% | 101.63 |
| Daily Pivot Point S1 | 101.54 |
| Daily Pivot Point S2 | 101 |
| Daily Pivot Point S3 | 100.69 |
| Daily Pivot Point R1 | 102.39 |
| Daily Pivot Point R2 | 102.69 |
| Daily Pivot Point R3 | 103.24 |
More By This Author:
Natural Gas Futures: No Changes To The Range Bound MoodEUR/USD Remains Weak And Approaches The 1.0900 Zone
Natural Gas Futures: Room For Further Losses


Comments
Log in or sign up to join the conversation.