

Image Source: Pexels
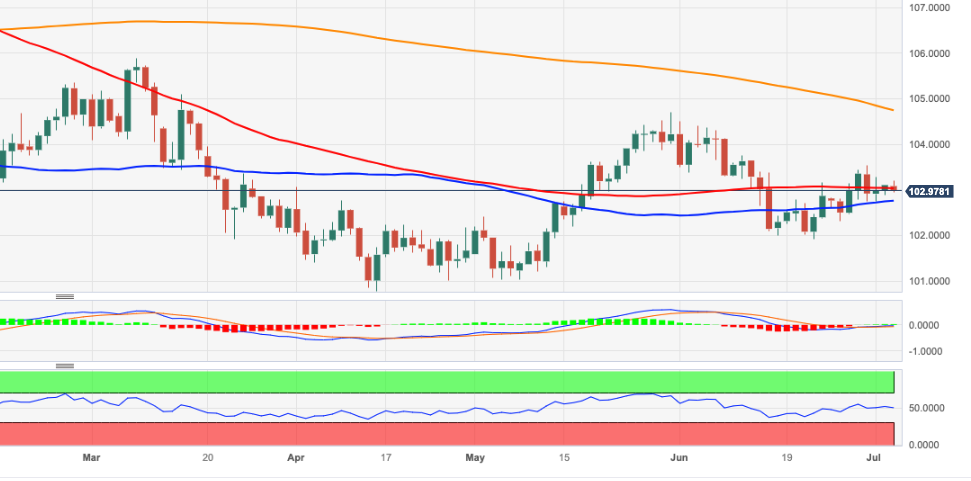
- DXY extends the weekly consolidative mood around 103.00.
- The resumption of the buying interest could challenge 103.50.
DXY alternates gains with losses amidst the weekly range-bound theme around the 103.00 zone on Wednesday.
While further consolidation seems probable in the very near term, the continuation of the uptrend in place since mid-June could challenge the weekly high at 103.54 (June 30) prior to the May high at 104.69 (May 31), which appears reinforced by the 200-day SMA.
Looking at the broader picture, while below the 200-day SMA at 104.74, the outlook for the index is expected to remain negative.
DXY daily chart
(Click on image to enlarge)
Dollar Index Spot
| OVERVIEW | |
|---|---|
| Today last price | 103 |
| Today Daily Change | 35 |
| Today Daily Change % | -0.11 |
| Today daily open | 103.11 |
| TRENDS | |
|---|---|
| Daily SMA20 | 102.92 |
| Daily SMA50 | 102.85 |
| Daily SMA100 | 103.04 |
| Daily SMA200 | 104.46 |
| LEVELS | |
|---|---|
| Previous Daily High | 103.11 |
| Previous Daily Low | 102.88 |
| Previous Weekly High | 103.55 |
| Previous Weekly Low | 102.32 |
| Previous Monthly High | 104.5 |
| Previous Monthly Low | 101.92 |
| Daily Fibonacci 38.2% | 103.03 |
| Daily Fibonacci 61.8% | 102.97 |
| Daily Pivot Point S1 | 102.95 |
| Daily Pivot Point S2 | 102.8 |
| Daily Pivot Point S3 | 102.72 |
| Daily Pivot Point R1 | 103.19 |
| Daily Pivot Point R2 | 103.27 |
| Daily Pivot Point R3 | 103.42 |
More By This Author:
Euro Remains Under Pressure Below 1.0900, Looks At FOMC MinutesEUR/USD Price Analysis: A More Convincing Upside Needs To Clear 1.1012
USD Index Treads Water Around The 103.00 Region


Comments
Log in or sign up to join the conversation.