

Image Source: Pexels
- The index remains on the defensive in the first half of the week.
- Next on the downside emerges the 102.60 zone.
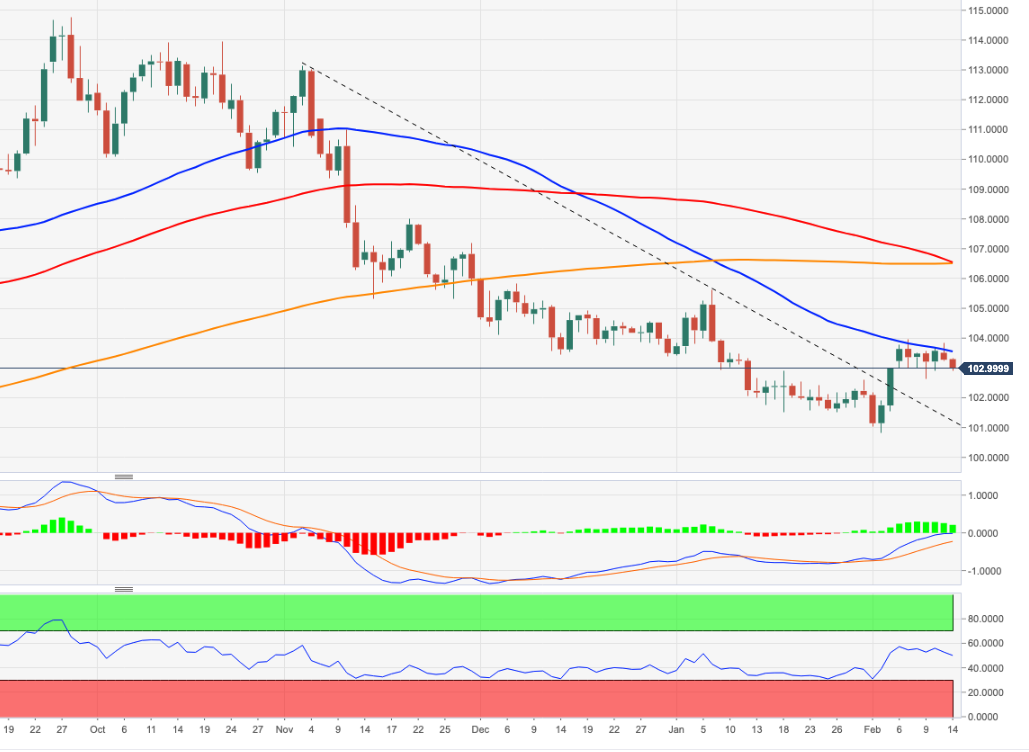
DXY adds to the bearish note recorded on Monday and puts the 103.00 support level to the test on Tuesday.
The recent price action leaves the door open to the continuation of the consolidative phase for the time being. However, a drop below last week’s low at 102.64 (February 9) should open the door to a deeper pullback in the short term to, initially, the 3-month support line, today near 102.35.
In the longer run, while below the 200-day SMA at 106.45, the outlook for the index remains negative.
DXY daily chart
(Click on image to enlarge)
Dollar Index Spot
| OVERVIEW | |
|---|---|
| Today last price | 103.01 |
| Today Daily Change | 35 |
| Today Daily Change % | -0.26 |
| Today daily open | 103.28 |
| TRENDS | |
|---|---|
| Daily SMA20 | 102.45 |
| Daily SMA50 | 103.42 |
| Daily SMA100 | 105.97 |
| Daily SMA200 | 106.73 |
| LEVELS | |
|---|---|
| Previous Daily High | 103.83 |
| Previous Daily Low | 103.24 |
| Previous Weekly High | 103.96 |
| Previous Weekly Low | 102.64 |
| Previous Monthly High | 105.63 |
| Previous Monthly Low | 101.5 |
| Daily Fibonacci 38.2% | 103.47 |
| Daily Fibonacci 61.8% | 103.61 |
| Daily Pivot Point S1 | 103.06 |
| Daily Pivot Point S2 | 102.85 |
| Daily Pivot Point S3 | 102.47 |
| Daily Pivot Point R1 | 103.66 |
| Daily Pivot Point R2 | 104.05 |
| Daily Pivot Point R3 | 104.26 |
More By This Author:
Natural Gas Futures: Door Open To Extra DeclineEUR/JPY Price Analysis: Losses Could Accelerate To 138.00 Near Term
Natural Gas Futures: Technical Rebound In The Offing? - Friday, Feb. 10


Comments
Log in or sign up to join the conversation.