
- DXY extends the rebound to 103.00 and above.
- Further downside likely on a breach of 102.00.
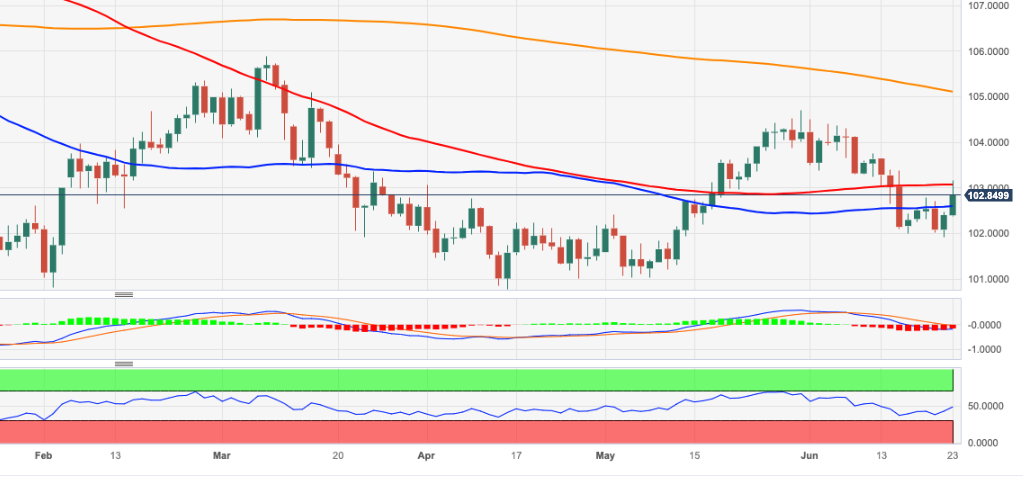
DXY adds to Thursday’s gains and reclaims the area beyond 103.00 the figure at the end of the week.
Despite the ongoing rebound, the index remains under pressure. That said, there is the palpable probability that a deeper pullback could drag DXY to the area of lows seen in April and May around 101.00 once the June low of 101.92 (June 22) is cleared. Dow from here emerges the 2023 low around 100.80 recorded on April 14.
Looking at the broader picture, while below the 200-day SMA at 105.10 the outlook for the index is expected to remain negative.
DXY daily chart
(Click on image to enlarge)
Dollar Index Spot
| OVERVIEW | |
|---|---|
| Today last price | 102.88 |
| Today Daily Change | 79 |
| Today Daily Change % | 0.47 |
| Today daily open | 102.4 |
| TRENDS | |
|---|---|
| Daily SMA20 | 103.37 |
| Daily SMA50 | 102.66 |
| Daily SMA100 | 103.08 |
| Daily SMA200 | 104.84 |
| LEVELS | |
|---|---|
| Previous Daily High | 102.47 |
| Previous Daily Low | 101.92 |
| Previous Weekly High | 103.76 |
| Previous Weekly Low | 102.01 |
| Previous Monthly High | 104.7 |
| Previous Monthly Low | 101.03 |
| Daily Fibonacci 38.2% | 102.26 |
| Daily Fibonacci 61.8% | 102.13 |
| Daily Pivot Point S1 | 102.06 |
| Daily Pivot Point S2 | 101.71 |
| Daily Pivot Point S3 | 101.51 |
| Daily Pivot Point R1 | 102.61 |
| Daily Pivot Point R2 | 102.81 |
| Daily Pivot Point R3 | 103.16 |
More By This Author:
Crude Oil Futures: Room For Extra RetracementsUSD Index Price Analysis: A Drop To 101.00 Appears In Store
EUR/GBP Picks Up Pace And Climbs To 3-Week Highs Past 0.8600


Comments
Log in or sign up to join the conversation.